
|
Zhejiang Construction Investment Group Co., Ltd (002761.sz) Valoración de DCF |
Completamente Editable: Adáptelo A Sus Necesidades En Excel O Sheets
Diseño Profesional: Plantillas Confiables Y Estándares De La Industria
Predeterminadas Para Un Uso Rápido Y Eficiente
Compatible con MAC / PC, completamente desbloqueado
No Se Necesita Experiencia; Fáciles De Seguir
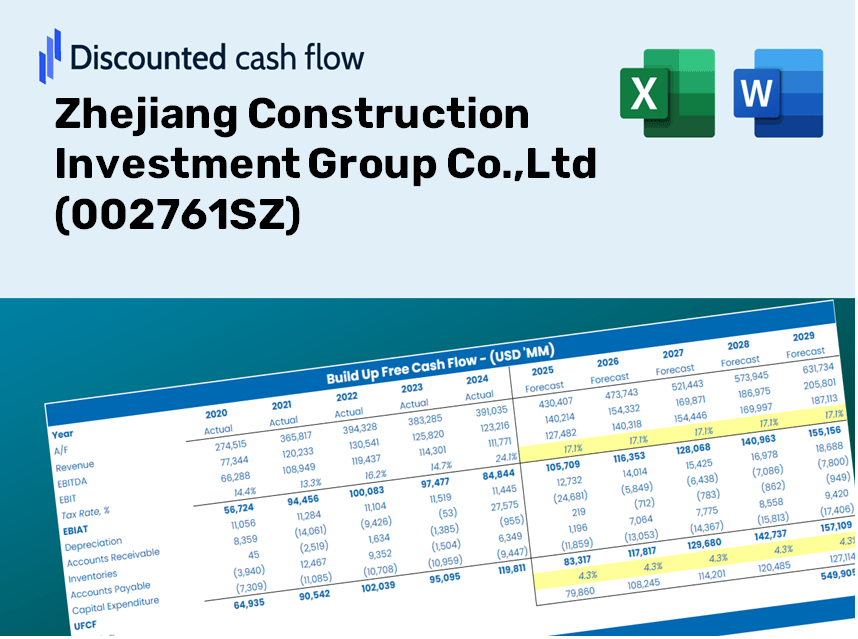
Zhejiang Construction Investment Group Co.,Ltd (002761.SZ) Bundle
¡Maximice la eficiencia y mejore la precisión con nuestra calculadora DCF (002761SZ)! Utilizando datos reales de Zhejiang Construction Investment Group Co., LTD y suposiciones personalizables, esta herramienta le permite pronosticar, analizar y valor (002761SZ) como un inversor experto.
What You Will Receive
- Authentic Zhejiang Construction Data: Preloaded financials – covering everything from revenue to EBIT – based on actual and projected figures.
- Comprehensive Customization: Modify all essential parameters (yellow cells) such as WACC, growth %, and tax rates.
- Real-Time Valuation Updates: Automatic recalibrations to assess the effects of changes on [Symbol]’s fair value.
- Dynamic Excel Template: Designed for quick modifications, scenario analysis, and in-depth projections.
- Efficient and Precise: Bypass the hassle of creating models from the ground up, while ensuring accuracy and adaptability.
Key Features
- Pre-Loaded Data: Historical financial statements and pre-filled forecasts for Zhejiang Construction Investment Group Co., Ltd (002761SZ).
- Fully Adjustable Inputs: Modify WACC, tax rates, revenue growth, and EBITDA margins as needed.
- Instant Results: Observe the intrinsic value for Zhejiang Construction Investment Group Co., Ltd (002761SZ) recalculating in real time.
- Clear Visual Outputs: Dashboard charts effectively showcase valuation results and key performance metrics.
- Built for Accuracy: A professional-grade tool tailored for analysts, investors, and finance professionals.
How It Works
- Step 1: Download the prebuilt Excel template featuring Zhejiang Construction Investment Group Co., Ltd’s (002761SZ) data.
- Step 2: Navigate through the pre-filled sheets to familiarize yourself with the key metrics.
- Step 3: Modify forecasts and assumptions in the editable yellow cells (WACC, growth, margins).
- Step 4: Instantly view recalculated results, including the intrinsic value of Zhejiang Construction Investment Group Co., Ltd (002761SZ).
- Step 5: Use the outputs to make informed investment decisions or generate comprehensive reports.
Why Opt for This Calculator?
- Designed for Experts: A sophisticated tool favored by analysts, CFOs, and consultants.
- Accurate Financial Insights: Historical and projected financial data for Zhejiang Construction Investment Group Co., Ltd (002761SZ) preloaded for precision.
- Flexible Scenario Analysis: Effortlessly simulate various forecasts and assumptions.
- Comprehensive Outputs: Automatically calculates intrinsic value, NPV, and essential metrics.
- User-Friendly Interface: Step-by-step guidance simplifies the entire process.
Who Can Benefit from This Product?
- Investors: Assess the value of Zhejiang Construction Investment Group Co., Ltd (002761SZ) before making buying or selling decisions.
- CFOs and Financial Analysts: Optimize valuation methodologies and evaluate forecasts more efficiently.
- Startup Founders: Understand how large public firms, such as Zhejiang Construction Investment Group Co., Ltd (002761SZ), are valued.
- Consultants: Create detailed valuation reports for your clients’ needs.
- Students and Educators: Utilize real-time data to learn and teach valuation strategies.
What the Template Contains
- Historical Data: Contains past financial performance and baseline forecasts for Zhejiang Construction Investment Group Co., Ltd (002761SZ).
- DCF and Levered DCF Models: Comprehensive templates for assessing the intrinsic value of Zhejiang Construction Investment Group Co., Ltd (002761SZ).
- WACC Sheet: Pre-calculated metrics for the Weighted Average Cost of Capital specific to Zhejiang Construction Investment Group Co., Ltd (002761SZ).
- Editable Inputs: Adjust essential variables such as growth rates, EBITDA percentages, and CAPEX projections.
- Quarterly and Annual Statements: A thorough analysis of the financial statements for Zhejiang Construction Investment Group Co., Ltd (002761SZ).
- Interactive Dashboard: Dynamically visualize valuation outcomes and future projections.
Disclaimer
All information, articles, and product details provided on this website are for general informational and educational purposes only. We do not claim any ownership over, nor do we intend to infringe upon, any trademarks, copyrights, logos, brand names, or other intellectual property mentioned or depicted on this site. Such intellectual property remains the property of its respective owners, and any references here are made solely for identification or informational purposes, without implying any affiliation, endorsement, or partnership.
We make no representations or warranties, express or implied, regarding the accuracy, completeness, or suitability of any content or products presented. Nothing on this website should be construed as legal, tax, investment, financial, medical, or other professional advice. In addition, no part of this site—including articles or product references—constitutes a solicitation, recommendation, endorsement, advertisement, or offer to buy or sell any securities, franchises, or other financial instruments, particularly in jurisdictions where such activity would be unlawful.
All content is of a general nature and may not address the specific circumstances of any individual or entity. It is not a substitute for professional advice or services. Any actions you take based on the information provided here are strictly at your own risk. You accept full responsibility for any decisions or outcomes arising from your use of this website and agree to release us from any liability in connection with your use of, or reliance upon, the content or products found herein.