
|
Chengdu Fusen Noble-House Industrial Co., Ltd. (002818.sz) Valoración de DCF |
Completamente Editable: Adáptelo A Sus Necesidades En Excel O Sheets
Diseño Profesional: Plantillas Confiables Y Estándares De La Industria
Predeterminadas Para Un Uso Rápido Y Eficiente
Compatible con MAC / PC, completamente desbloqueado
No Se Necesita Experiencia; Fáciles De Seguir
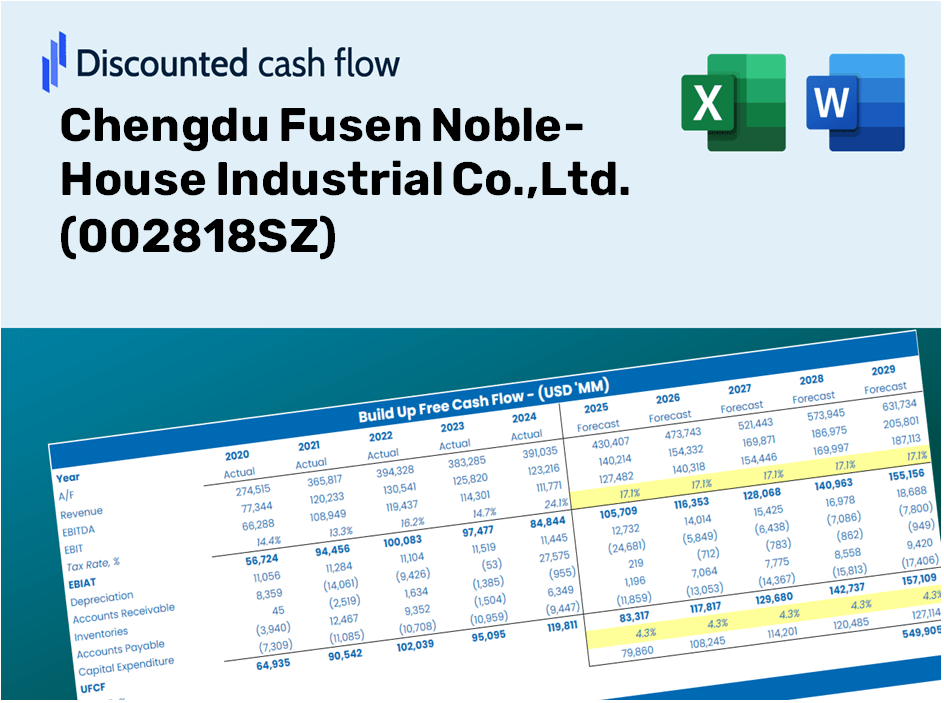
Chengdu Fusen Noble-House Industrial Co.,Ltd. (002818.SZ) Bundle
¿Busca evaluar el valor intrínseco de Chengdu Fusen Noble-House Industrial Co., Ltd.? Nuestra calculadora DCF (002818SZ) integra datos del mundo real con opciones de personalización integrales, lo que le permite refinar sus pronósticos y mejorar sus estrategias de inversión.
Discounted Cash Flow (DCF) - (USD MM)
| Year | AY1 2020 |
AY2 2021 |
AY3 2022 |
AY4 2023 |
AY5 2024 |
FY1 2025 |
FY2 2026 |
FY3 2027 |
FY4 2028 |
FY5 2029 |
|---|---|---|---|---|---|---|---|---|---|---|
| Revenue | 1,327.6 | 1,536.8 | 1,482.7 | 1,524.1 | 1,429.9 | 1,461.5 | 1,493.8 | 1,526.9 | 1,560.6 | 1,595.2 |
| Revenue Growth, % | 0 | 15.76 | -3.52 | 2.79 | -6.18 | 2.21 | 2.21 | 2.21 | 2.21 | 2.21 |
| EBITDA | 1,129.5 | 1,220.7 | 1,138.9 | 1,117.8 | 1,073.2 | 1,139.2 | 1,164.4 | 1,190.1 | 1,216.4 | 1,243.3 |
| EBITDA, % | 85.08 | 79.43 | 76.81 | 73.34 | 75.06 | 77.94 | 77.94 | 77.94 | 77.94 | 77.94 |
| Depreciation | 231.1 | 204.5 | 197.5 | 193.7 | 235.3 | 214.0 | 218.7 | 223.5 | 228.5 | 233.5 |
| Depreciation, % | 17.41 | 13.31 | 13.32 | 12.71 | 16.46 | 14.64 | 14.64 | 14.64 | 14.64 | 14.64 |
| EBIT | 898.3 | 1,016.2 | 941.5 | 924.1 | 837.9 | 925.2 | 945.7 | 966.6 | 988.0 | 1,009.8 |
| EBIT, % | 67.67 | 66.12 | 63.49 | 60.63 | 58.6 | 63.3 | 63.3 | 63.3 | 63.3 | 63.3 |
| Total Cash | 1,769.5 | 1,819.9 | 1,577.2 | 1,257.5 | 1,239.4 | 1,371.4 | 1,401.8 | 1,432.8 | 1,464.5 | 1,496.9 |
| Total Cash, percent | .0 | .0 | .0 | .0 | .0 | .0 | .0 | .0 | .0 | .0 |
| Account Receivables | 81.8 | 780.2 | 445.4 | 564.9 | 105.4 | 384.1 | 392.6 | 401.3 | 410.1 | 419.2 |
| Account Receivables, % | 6.16 | 50.77 | 30.04 | 37.06 | 7.37 | 26.28 | 26.28 | 26.28 | 26.28 | 26.28 |
| Inventories | 182.3 | 240.6 | 344.7 | 431.5 | 494.9 | 337.8 | 345.2 | 352.9 | 360.7 | 368.7 |
| Inventories, % | 13.73 | 15.65 | 23.25 | 28.31 | 34.61 | 23.11 | 23.11 | 23.11 | 23.11 | 23.11 |
| Accounts Payable | 38.4 | 46.8 | 48.6 | 60.1 | 205.2 | 80.4 | 82.2 | 84.0 | 85.9 | 87.8 |
| Accounts Payable, % | 2.89 | 3.05 | 3.28 | 3.95 | 14.35 | 5.5 | 5.5 | 5.5 | 5.5 | 5.5 |
| Capital Expenditure | -46.3 | -292.3 | -279.3 | -172.8 | -54.0 | -165.0 | -168.7 | -172.4 | -176.2 | -180.1 |
| Capital Expenditure, % | -3.49 | -19.02 | -18.84 | -11.34 | -3.77 | -11.29 | -11.29 | -11.29 | -11.29 | -11.29 |
| Tax Rate, % | 17.57 | 17.57 | 17.57 | 17.57 | 17.57 | 17.57 | 17.57 | 17.57 | 17.57 | 17.57 |
| EBITAT | 753.3 | 850.9 | 781.5 | 769.9 | 690.7 | 770.4 | 787.4 | 804.8 | 822.6 | 840.8 |
| Depreciation | ||||||||||
| Changes in Account Receivables | ||||||||||
| Changes in Inventories | ||||||||||
| Changes in Accounts Payable | ||||||||||
| Capital Expenditure | ||||||||||
| UFCF | 712.4 | 14.8 | 932.0 | 596.0 | 1,413.2 | 572.9 | 823.2 | 841.4 | 860.1 | 879.1 |
| WACC, % | 5.35 | 5.35 | 5.35 | 5.35 | 5.35 | 5.35 | 5.35 | 5.35 | 5.35 | 5.35 |
| PV UFCF | ||||||||||
| SUM PV UFCF | 3,381.2 | |||||||||
| Long Term Growth Rate, % | 2.00 | |||||||||
| Free cash flow (T + 1) | 897 | |||||||||
| Terminal Value | 26,793 | |||||||||
| Present Terminal Value | 20,650 | |||||||||
| Enterprise Value | 24,031 | |||||||||
| Net Debt | -314 | |||||||||
| Equity Value | 24,345 | |||||||||
| Diluted Shares Outstanding, MM | 748 | |||||||||
| Equity Value Per Share | 32.53 |
What You Will Receive
- Authentic Fusen Financial Data: Comes pre-loaded with Chengdu Fusen Noble-House’s historical and projected data for accurate analysis.
- Customizable Template: Easily adjust key inputs such as revenue growth, WACC, and EBITDA percentage.
- Instant Calculations: Watch Fusen’s intrinsic value change in real-time as you make adjustments.
- Advanced Valuation Tool: Tailored for investors, analysts, and consultants aiming for reliable DCF outcomes.
- User-Friendly Interface: Designed with a clear layout and straightforward instructions suitable for all skill levels.
Key Features
- Pre-Loaded Information: Historical financial data and pre-populated forecasts for Chengdu Fusen Noble-House Industrial Co., Ltd. (002818SZ).
- Customizable Parameters: Adjust WACC, tax rates, revenue growth, and EBITDA margins to fit your analysis.
- Real-Time Insights: Monitor the intrinsic value of Chengdu Fusen Noble-House Industrial Co., Ltd. (002818SZ) as it updates instantly.
- Visual Data Presentation: Intuitive dashboard charts illustrate valuation results and essential metrics.
- Designed for Precision: A robust tool tailored for analysts, investors, and finance professionals.
How It Works
- Download the Template: Gain immediate access to the Excel-based Chengdu Fusen Noble-House DCF Calculator for (002818SZ).
- Input Your Assumptions: Modify the yellow-highlighted cells for growth rates, WACC, profit margins, and other key metrics.
- Instant Calculations: The model automatically calculates the intrinsic value of Chengdu Fusen Noble-House.
- Test Scenarios: Experiment with various assumptions to assess potential valuation fluctuations.
- Analyze and Decide: Leverage the results to inform your investment decisions or financial assessments.
Why Select This Calculator?
- User-Friendly and Accessible: Ideal for both novices and seasoned professionals.
- Customizable Inputs: Adjust parameters effortlessly for tailored analysis.
- Real-Time Valuation: Witness immediate updates to Chengdu Fusen Noble-House Industrial Co.,Ltd.'s valuation as you tweak the inputs.
- Pre-Configured: Comes with Chengdu Fusen Noble-House Industrial Co.,Ltd.'s actual financial metrics for swift evaluations.
- Endorsed by Experts: Favored by investors and analysts for making well-informed choices.
Who Should Use This Product?
- Individual Investors: Make informed decisions about buying or selling shares of Chengdu Fusen Noble-House Industrial Co.,Ltd. (002818SZ).
- Financial Analysts: Enhance valuation processes with accessible financial models tailored for Chengdu Fusen Noble-House Industrial Co.,Ltd. (002818SZ).
- Consultants: Provide clients with prompt and precise valuation insights regarding Chengdu Fusen Noble-House Industrial Co.,Ltd. (002818SZ).
- Business Owners: Gain a deeper understanding of how large companies like Chengdu Fusen Noble-House Industrial Co.,Ltd. (002818SZ) are valued to inform your own business strategy.
- Finance Students: Explore valuation methods using real-world data and scenarios related to Chengdu Fusen Noble-House Industrial Co.,Ltd. (002818SZ).
Contents of the Template
- Preloaded Fusen Data: Historical and projected financial metrics, including revenue, EBIT, and capital expenditures.
- DCF and WACC Models: Advanced spreadsheets for determining intrinsic value and Weighted Average Cost of Capital.
- Customizable Inputs: Yellow-highlighted cells for modifying revenue growth rates, tax rates, and discount rates.
- Financial Statements: Detailed annual and quarterly financial reports for thorough analysis.
- Key Ratios: Metrics for profitability, leverage, and efficiency to assess company performance.
- Dashboard and Visualizations: Graphical summaries of valuation results and underlying assumptions.
Disclaimer
All information, articles, and product details provided on this website are for general informational and educational purposes only. We do not claim any ownership over, nor do we intend to infringe upon, any trademarks, copyrights, logos, brand names, or other intellectual property mentioned or depicted on this site. Such intellectual property remains the property of its respective owners, and any references here are made solely for identification or informational purposes, without implying any affiliation, endorsement, or partnership.
We make no representations or warranties, express or implied, regarding the accuracy, completeness, or suitability of any content or products presented. Nothing on this website should be construed as legal, tax, investment, financial, medical, or other professional advice. In addition, no part of this site—including articles or product references—constitutes a solicitation, recommendation, endorsement, advertisement, or offer to buy or sell any securities, franchises, or other financial instruments, particularly in jurisdictions where such activity would be unlawful.
All content is of a general nature and may not address the specific circumstances of any individual or entity. It is not a substitute for professional advice or services. Any actions you take based on the information provided here are strictly at your own risk. You accept full responsibility for any decisions or outcomes arising from your use of this website and agree to release us from any liability in connection with your use of, or reliance upon, the content or products found herein.