
|
Shenzhen TXD Technology Co., Ltd. (002845.Sz) Valoración de DCF |
Completamente Editable: Adáptelo A Sus Necesidades En Excel O Sheets
Diseño Profesional: Plantillas Confiables Y Estándares De La Industria
Predeterminadas Para Un Uso Rápido Y Eficiente
Compatible con MAC / PC, completamente desbloqueado
No Se Necesita Experiencia; Fáciles De Seguir
Shenzhen TXD Technology Co., Ltd. (002845.SZ) Bundle
¡Explore el futuro financiero de Shenzhen TXD Technology Co., Ltd. (002845SZ) con nuestra calculadora DCF fácil de usar! Ingrese sus suposiciones para el crecimiento, los márgenes y los costos para determinar el valor intrínseco de Shenzhen TXD Technology Co., Ltd. (002845SZ) y mejorar su estrategia de inversión.
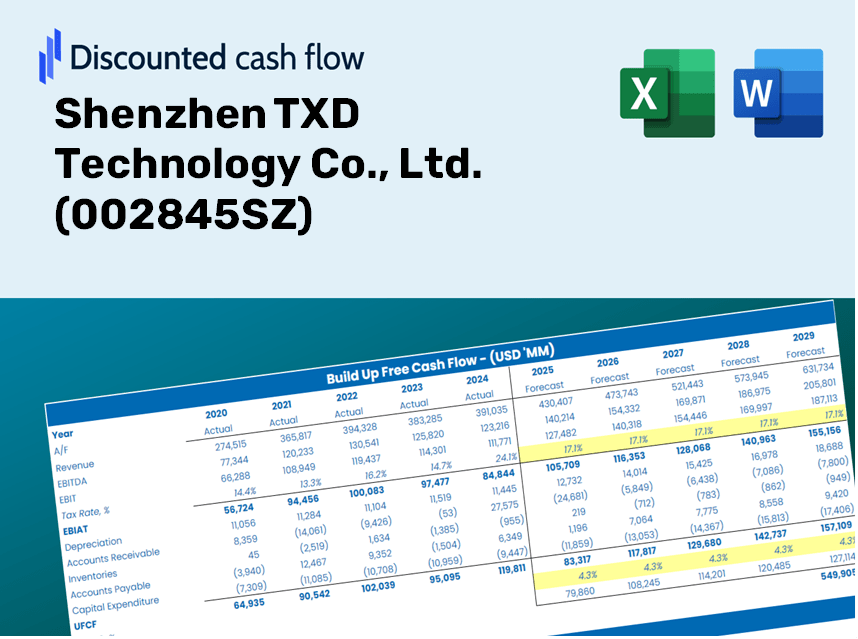
Discounted Cash Flow (DCF) - (USD MM)
| Year | AY1 2020 |
AY2 2021 |
AY3 2022 |
AY4 2023 |
AY5 2024 |
FY1 2025 |
FY2 2026 |
FY3 2027 |
FY4 2028 |
FY5 2029 |
|---|---|---|---|---|---|---|---|---|---|---|
| Revenue | 10,601.1 | 12,860.4 | 8,418.8 | 8,514.0 | 9,558.8 | 10,865.3 | 12,350.4 | 14,038.4 | 15,957.2 | 18,138.3 |
| Revenue Growth, % | 0 | 21.31 | -34.54 | 1.13 | 12.27 | 13.67 | 13.67 | 13.67 | 13.67 | 13.67 |
| EBITDA | 558.3 | 719.1 | 175.1 | 256.0 | 242.2 | 401.5 | 456.4 | 518.8 | 589.7 | 670.3 |
| EBITDA, % | 5.27 | 5.59 | 2.08 | 3.01 | 2.53 | 3.7 | 3.7 | 3.7 | 3.7 | 3.7 |
| Depreciation | 143.4 | 192.1 | 230.5 | 233.2 | 222.6 | 231.5 | 263.1 | 299.1 | 339.9 | 386.4 |
| Depreciation, % | 1.35 | 1.49 | 2.74 | 2.74 | 2.33 | 2.13 | 2.13 | 2.13 | 2.13 | 2.13 |
| EBIT | 415.0 | 527.0 | -55.4 | 22.8 | 19.6 | 170.1 | 193.3 | 219.7 | 249.8 | 283.9 |
| EBIT, % | 3.91 | 4.1 | -0.65797 | 0.26732 | 0.2051 | 1.57 | 1.57 | 1.57 | 1.57 | 1.57 |
| Total Cash | 1,692.1 | 1,512.2 | 1,200.7 | 900.3 | 1,202.0 | 1,415.3 | 1,608.8 | 1,828.7 | 2,078.6 | 2,362.7 |
| Total Cash, percent | .0 | .0 | .0 | .0 | .0 | .0 | .0 | .0 | .0 | .0 |
| Account Receivables | 3,731.8 | 4,008.9 | 2,361.4 | 3,043.3 | 3,290.8 | 3,576.8 | 4,065.6 | 4,621.3 | 5,253.0 | 5,971.0 |
| Account Receivables, % | 35.2 | 31.17 | 28.05 | 35.74 | 34.43 | 32.92 | 32.92 | 32.92 | 32.92 | 32.92 |
| Inventories | 1,688.3 | 1,321.1 | 1,223.5 | 1,336.5 | 1,412.4 | 1,547.3 | 1,758.8 | 1,999.2 | 2,272.5 | 2,583.1 |
| Inventories, % | 15.93 | 10.27 | 14.53 | 15.7 | 14.78 | 14.24 | 14.24 | 14.24 | 14.24 | 14.24 |
| Accounts Payable | 4,762.7 | 4,779.3 | 3,104.2 | 3,993.1 | 4,454.1 | 4,616.8 | 5,247.9 | 5,965.2 | 6,780.5 | 7,707.2 |
| Accounts Payable, % | 44.93 | 37.16 | 36.87 | 46.9 | 46.6 | 42.49 | 42.49 | 42.49 | 42.49 | 42.49 |
| Capital Expenditure | -533.9 | -377.1 | -464.8 | -555.4 | -319.0 | -507.4 | -576.8 | -655.6 | -745.2 | -847.1 |
| Capital Expenditure, % | -5.04 | -2.93 | -5.52 | -6.52 | -3.34 | -4.67 | -4.67 | -4.67 | -4.67 | -4.67 |
| Tax Rate, % | 194.25 | 194.25 | 194.25 | 194.25 | 194.25 | 194.25 | 194.25 | 194.25 | 194.25 | 194.25 |
| EBITAT | 350.3 | 430.9 | -23.4 | -42.1 | -18.5 | 70.9 | 80.6 | 91.6 | 104.1 | 118.3 |
| Depreciation | ||||||||||
| Changes in Account Receivables | ||||||||||
| Changes in Inventories | ||||||||||
| Changes in Accounts Payable | ||||||||||
| Capital Expenditure | ||||||||||
| UFCF | -697.6 | 352.5 | -187.6 | -270.3 | 22.7 | -463.2 | -302.4 | -343.8 | -390.8 | -444.2 |
| WACC, % | 4.29 | 4.26 | 3.87 | 3.46 | 3.46 | 3.87 | 3.87 | 3.87 | 3.87 | 3.87 |
| PV UFCF | ||||||||||
| SUM PV UFCF | -1,736.2 | |||||||||
| Long Term Growth Rate, % | 3.50 | |||||||||
| Free cash flow (T + 1) | -460 | |||||||||
| Terminal Value | -124,774 | |||||||||
| Present Terminal Value | -103,206 | |||||||||
| Enterprise Value | -104,942 | |||||||||
| Net Debt | 190 | |||||||||
| Equity Value | -105,132 | |||||||||
| Diluted Shares Outstanding, MM | 328 | |||||||||
| Equity Value Per Share | -320.96 |
Benefits You Will Receive
- Pre-Filled Financial Model: Utilize Shenzhen TXD Technology Co., Ltd.'s (002845SZ) actual data for accurate DCF valuation.
- Comprehensive Forecast Control: Tailor revenue growth, profit margins, WACC, and other vital factors to your needs.
- Immediate Calculations: Real-time updates provide instant feedback as you adjust inputs.
- Investor-Ready Template: A polished Excel workbook crafted for professional valuation standards.
- Customizable and Reusable: Designed for adaptability, enabling ongoing use for in-depth forecasts.
Key Features
- Real Shenzhen TXD Financials: Gain access to reliable historical data and future forecasts that are pre-loaded.
- Customizable Forecast Assumptions: Modify the highlighted cells for key inputs like WACC, growth rates, and profit margins.
- Dynamic Calculations: Automatic updates for DCF, Net Present Value (NPV), and cash flow assessments.
- Visual Dashboard: User-friendly charts and summaries to help you easily interpret your valuation outcomes.
- Designed for All Levels: An intuitive layout catered to investors, CFOs, and consultants, whether novice or expert.
How It Functions
- Step 1: Download the ready-to-use Excel template featuring data for Shenzhen TXD Technology Co., Ltd. (002845SZ).
- Step 2: Examine the pre-filled sheets to familiarize yourself with the essential metrics.
- Step 3: Update your forecasts and assumptions in the editable yellow cells (WACC, growth, margins).
- Step 4: Instantly view the recalculated outcomes, including the intrinsic value of Shenzhen TXD Technology Co., Ltd. (002845SZ).
- Step 5: Make informed investment decisions or create reports based on the generated results.
Why Opt for Our Calculator?
- Designed for Experts: A sophisticated tool tailored for analysts, CFOs, and industry consultants.
- Accurate Financial Data: Preloaded with Shenzhen TXD Technology Co., Ltd.'s historical and projected financials for precision.
- Scenario Analysis: Effortlessly test various forecasts and assumptions.
- Transparent Results: Instantly computes intrinsic value, NPV, and essential metrics.
- User-Friendly: Comprehensive step-by-step instructions make navigation simple.
Who Can Benefit from This Product?
- Investors: Assess the valuation of Shenzhen TXD Technology Co., Ltd. (002845SZ) before making investment decisions.
- CFOs and Financial Analysts: Enhance the efficiency of valuation processes and validate financial projections.
- Startup Founders: Gain insights into the valuation methodologies used for larger companies like Shenzhen TXD Technology Co., Ltd. (002845SZ).
- Consultants: Provide comprehensive valuation reports for your clients.
- Students and Educators: Utilize real market data to practice and teach valuation strategies.
Contents of the Template
- Pre-Filled Data: Features Shenzhen TXD Technology Co., Ltd.'s historical financial figures and projections.
- Discounted Cash Flow Model: Customizable DCF valuation model with automatic calculation functionalities.
- Weighted Average Cost of Capital (WACC): A specialized sheet for WACC calculations based on user-defined inputs.
- Key Financial Ratios: Evaluate Shenzhen TXD Technology Co., Ltd.'s profitability, operational efficiency, and leverage ratios.
- Customizable Inputs: Easily modify revenue growth, margins, and tax rates.
- Clear Dashboard: Visual representations and tables summarizing essential valuation outcomes.
Disclaimer
All information, articles, and product details provided on this website are for general informational and educational purposes only. We do not claim any ownership over, nor do we intend to infringe upon, any trademarks, copyrights, logos, brand names, or other intellectual property mentioned or depicted on this site. Such intellectual property remains the property of its respective owners, and any references here are made solely for identification or informational purposes, without implying any affiliation, endorsement, or partnership.
We make no representations or warranties, express or implied, regarding the accuracy, completeness, or suitability of any content or products presented. Nothing on this website should be construed as legal, tax, investment, financial, medical, or other professional advice. In addition, no part of this site—including articles or product references—constitutes a solicitation, recommendation, endorsement, advertisement, or offer to buy or sell any securities, franchises, or other financial instruments, particularly in jurisdictions where such activity would be unlawful.
All content is of a general nature and may not address the specific circumstances of any individual or entity. It is not a substitute for professional advice or services. Any actions you take based on the information provided here are strictly at your own risk. You accept full responsibility for any decisions or outcomes arising from your use of this website and agree to release us from any liability in connection with your use of, or reliance upon, the content or products found herein.