
|
Zhejiang Mtcn Technology Co., Ltd. (003026.sz) Valoración de DCF |
Completamente Editable: Adáptelo A Sus Necesidades En Excel O Sheets
Diseño Profesional: Plantillas Confiables Y Estándares De La Industria
Predeterminadas Para Un Uso Rápido Y Eficiente
Compatible con MAC / PC, completamente desbloqueado
No Se Necesita Experiencia; Fáciles De Seguir
Zhejiang MTCN Technology Co.,Ltd. (003026.SZ) Bundle
¡Agilice su análisis y mejore la precisión con nuestra calculadora DCF (003026SZ)! Utilizando datos reales de Zhejiang Mtcn Technology Co., Ltd. y suposiciones personalizables, esta herramienta le permite pronosticar, evaluar y valorar la tecnología Zhejiang MTCN como un inversor experimentado.
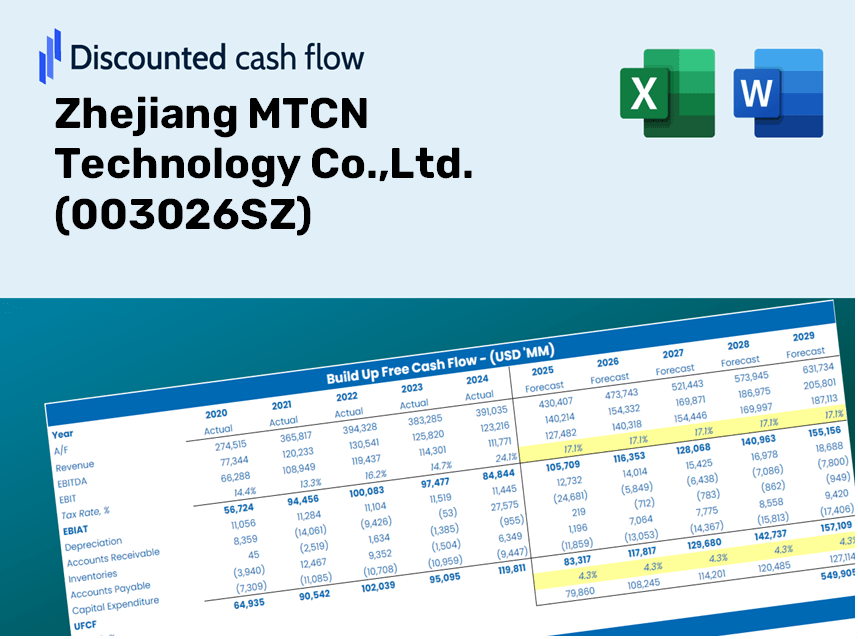
Discounted Cash Flow (DCF) - (USD MM)
| Year | AY1 2020 |
AY2 2021 |
AY3 2022 |
AY4 2023 |
AY5 2024 |
FY1 2025 |
FY2 2026 |
FY3 2027 |
FY4 2028 |
FY5 2029 |
|---|---|---|---|---|---|---|---|---|---|---|
| Revenue | 272.9 | 437.0 | 338.1 | 348.5 | 422.6 | 487.9 | 563.3 | 650.4 | 750.9 | 867.0 |
| Revenue Growth, % | 0 | 60.13 | -22.62 | 3.06 | 21.25 | 15.46 | 15.46 | 15.46 | 15.46 | 15.46 |
| EBITDA | 111.4 | 184.4 | 86.2 | 33.8 | 103.6 | 139.3 | 160.8 | 185.6 | 214.3 | 247.5 |
| EBITDA, % | 40.82 | 42.2 | 25.49 | 9.71 | 24.51 | 28.54 | 28.54 | 28.54 | 28.54 | 28.54 |
| Depreciation | 13.7 | 22.4 | 43.1 | 57.4 | 64.7 | 53.4 | 61.6 | 71.1 | 82.1 | 94.8 |
| Depreciation, % | 5.02 | 5.13 | 12.73 | 16.47 | 15.32 | 10.94 | 10.94 | 10.94 | 10.94 | 10.94 |
| EBIT | 97.7 | 162.0 | 43.1 | -23.6 | 38.8 | 85.9 | 99.2 | 114.5 | 132.2 | 152.7 |
| EBIT, % | 35.8 | 37.06 | 12.75 | -6.76 | 9.19 | 17.61 | 17.61 | 17.61 | 17.61 | 17.61 |
| Total Cash | 400.0 | 392.3 | 398.4 | 311.2 | 166.4 | 408.3 | 471.5 | 544.3 | 628.5 | 725.6 |
| Total Cash, percent | .0 | .0 | .0 | .0 | .0 | .0 | .0 | .0 | .0 | .0 |
| Account Receivables | 166.5 | 223.8 | 139.8 | 145.8 | 196.3 | 236.0 | 272.5 | 314.6 | 363.2 | 419.4 |
| Account Receivables, % | 61 | 51.21 | 41.35 | 41.83 | 46.46 | 48.37 | 48.37 | 48.37 | 48.37 | 48.37 |
| Inventories | 66.8 | 146.6 | 198.1 | 130.7 | 108.2 | 175.3 | 202.5 | 233.7 | 269.9 | 311.6 |
| Inventories, % | 24.47 | 33.54 | 58.58 | 37.51 | 25.6 | 35.94 | 35.94 | 35.94 | 35.94 | 35.94 |
| Accounts Payable | 49.1 | 194.5 | 195.4 | 135.4 | 145.8 | 188.9 | 218.1 | 251.9 | 290.8 | 335.8 |
| Accounts Payable, % | 17.99 | 44.51 | 57.8 | 38.84 | 34.49 | 38.73 | 38.73 | 38.73 | 38.73 | 38.73 |
| Capital Expenditure | -13.3 | -160.1 | -225.6 | -126.6 | -29.0 | -147.7 | -170.6 | -196.9 | -227.4 | -262.5 |
| Capital Expenditure, % | -4.86 | -36.64 | -66.71 | -36.32 | -6.86 | -30.28 | -30.28 | -30.28 | -30.28 | -30.28 |
| Tax Rate, % | 14.91 | 14.91 | 14.91 | 14.91 | 14.91 | 14.91 | 14.91 | 14.91 | 14.91 | 14.91 |
| EBITAT | 86.5 | 132.5 | 41.2 | -23.2 | 33.0 | 77.2 | 89.1 | 102.9 | 118.8 | 137.2 |
| Depreciation | ||||||||||
| Changes in Account Receivables | ||||||||||
| Changes in Inventories | ||||||||||
| Changes in Accounts Payable | ||||||||||
| Capital Expenditure | ||||||||||
| UFCF | -97.2 | 3.1 | -107.9 | -91.0 | 51.1 | -80.8 | -54.2 | -62.6 | -72.2 | -83.4 |
| WACC, % | 7.68 | 7.66 | 7.69 | 7.7 | 7.67 | 7.68 | 7.68 | 7.68 | 7.68 | 7.68 |
| PV UFCF | ||||||||||
| SUM PV UFCF | -283.2 | |||||||||
| Long Term Growth Rate, % | 4.00 | |||||||||
| Free cash flow (T + 1) | -87 | |||||||||
| Terminal Value | -2,357 | |||||||||
| Present Terminal Value | -1,628 | |||||||||
| Enterprise Value | -1,912 | |||||||||
| Net Debt | 23 | |||||||||
| Equity Value | -1,934 | |||||||||
| Diluted Shares Outstanding, MM | 127 | |||||||||
| Equity Value Per Share | -15.29 |
What You Will Receive
- Pre-Loaded Financial Model: Utilize Zhejiang MTCN Technology's actual data for accurate DCF valuation.
- Comprehensive Forecast Control: Modify revenue growth, profit margins, WACC, and other essential metrics.
- Real-Time Calculations: Automatic updates provide immediate feedback as adjustments are made.
- Professional-Grade Template: A polished Excel file crafted for high-quality valuation presentations.
- Flexible and Reusable: Designed with customization in mind, suitable for multiple detailed forecasting scenarios.
Key Features
- Comprehensive Historical Data: Access Zhejiang MTCN Technology Co., Ltd.'s historical financial reports along with pre-populated forecasts.
- Customizable Parameters: Adjust inputs for WACC, tax rates, revenue growth, and EBITDA margins to tailor your analysis.
- Real-Time Calculations: Instantly view the recalculated intrinsic value of Zhejiang MTCN Technology Co., Ltd. in real time.
- Intuitive Visual Outputs: Utilize dashboard charts to illustrate valuation outcomes and important metrics.
- Designed for Precision: A robust tool specifically crafted for analysts, investors, and financial professionals.
How It Functions
- Download the Template: Gain immediate access to the Excel-based ZHEJIANG MTCN DCF Calculator for [003026SZ].
- Input Your Assumptions: Modify the yellow-highlighted cells to reflect growth rates, WACC, profit margins, and other key factors.
- Instant Calculations: The model will automatically recalculate the intrinsic value of Zhejiang MTCN Technology Co., Ltd.
- Test Scenarios: Experiment with various assumptions to assess potential changes in valuation.
- Analyze and Decide: Utilize the outcomes to inform your investment or financial decisions.
Why Choose This Calculator for Zhejiang MTCN Technology Co., Ltd. (003026SZ)?
- Reliable Data: Utilize accurate financial information from Zhejiang MTCN for trustworthy valuation outcomes.
- Flexible Options: Modify essential factors like growth rates, WACC, and tax rates to align with your expectations.
- Efficient: Pre-configured calculations save you the hassle of starting from the ground up.
- Expert-Level Tool: Tailored for investors, analysts, and consultants in the tech industry.
- Easy to Use: Clear design and guided steps make it accessible for users of all experience levels.
Who Can Benefit from This Product?
- Finance Students: Master valuation techniques and apply them with authentic data.
- Researchers: Integrate industry-standard models into your academic projects and studies.
- Investors: Challenge your assumptions and evaluate valuation results for Zhejiang MTCN Technology Co.,Ltd. (003026SZ).
- Financial Analysts: Enhance your efficiency with a ready-to-use, customizable DCF model.
- Entrepreneurs: Understand the analytical methods used for assessing large publicly traded companies like Zhejiang MTCN Technology Co.,Ltd. (003026SZ).
Contents of the Template
- Comprehensive DCF Model: Editable template featuring in-depth valuation calculations.
- Real-World Data: Preloaded historical and projected financials for Zhejiang MTCN Technology Co., Ltd. (003026SZ) to facilitate analysis.
- Customizable Parameters: Modify WACC, growth rates, and tax assumptions to explore various scenarios.
- Financial Statements: Complete annual and quarterly financial breakdowns for enhanced insights.
- Key Ratios: Integrated analysis of profitability, efficiency, and leverage metrics.
- Dashboard with Visual Outputs: Charts and tables designed for clear, actionable results.
Disclaimer
All information, articles, and product details provided on this website are for general informational and educational purposes only. We do not claim any ownership over, nor do we intend to infringe upon, any trademarks, copyrights, logos, brand names, or other intellectual property mentioned or depicted on this site. Such intellectual property remains the property of its respective owners, and any references here are made solely for identification or informational purposes, without implying any affiliation, endorsement, or partnership.
We make no representations or warranties, express or implied, regarding the accuracy, completeness, or suitability of any content or products presented. Nothing on this website should be construed as legal, tax, investment, financial, medical, or other professional advice. In addition, no part of this site—including articles or product references—constitutes a solicitation, recommendation, endorsement, advertisement, or offer to buy or sell any securities, franchises, or other financial instruments, particularly in jurisdictions where such activity would be unlawful.
All content is of a general nature and may not address the specific circumstances of any individual or entity. It is not a substitute for professional advice or services. Any actions you take based on the information provided here are strictly at your own risk. You accept full responsibility for any decisions or outcomes arising from your use of this website and agree to release us from any liability in connection with your use of, or reliance upon, the content or products found herein.