
|
Guangdong Shunkong Development Co., Ltd. (003039.sz) valoración de DCF |
Completamente Editable: Adáptelo A Sus Necesidades En Excel O Sheets
Diseño Profesional: Plantillas Confiables Y Estándares De La Industria
Predeterminadas Para Un Uso Rápido Y Eficiente
Compatible con MAC / PC, completamente desbloqueado
No Se Necesita Experiencia; Fáciles De Seguir
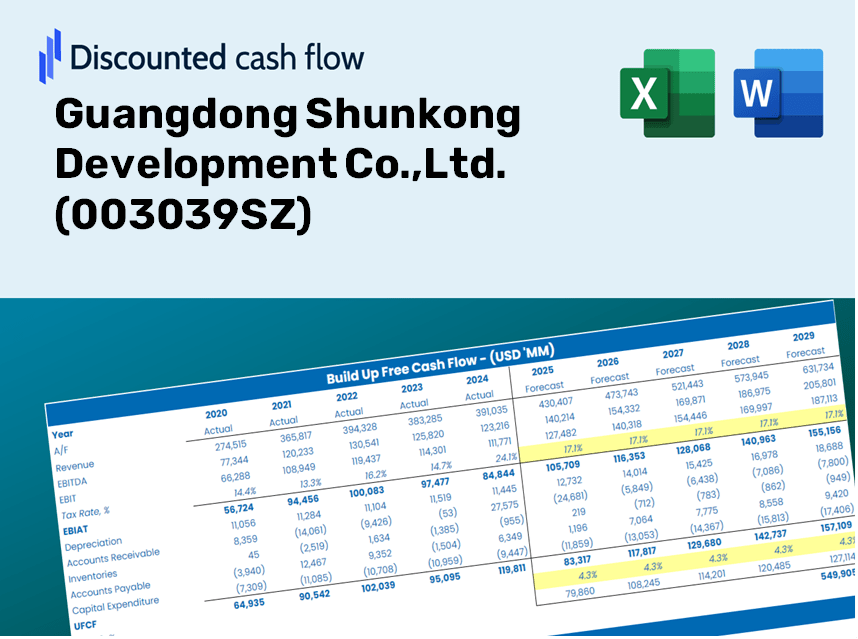
Guangdong Shunkong Development Co.,Ltd. (003039.SZ) Bundle
¡Mejore sus estrategias de inversión con la calculadora DCF (003039SZ)! Utilice datos financieros reales de Guangdong Shunkong Development Co., Ltd., ajuste las predicciones y gastos de crecimiento, y observe instantáneamente cómo estas modificaciones afectan el valor intrínseco de la empresa.
Discounted Cash Flow (DCF) - (USD MM)
| Year | AY1 2020 |
AY2 2021 |
AY3 2022 |
AY4 2023 |
AY5 2024 |
FY1 2025 |
FY2 2026 |
FY3 2027 |
FY4 2028 |
FY5 2029 |
|---|---|---|---|---|---|---|---|---|---|---|
| Revenue | 1,234.2 | 1,338.1 | 1,319.6 | 1,455.6 | 1,838.9 | 2,039.6 | 2,262.3 | 2,509.3 | 2,783.3 | 3,087.2 |
| Revenue Growth, % | 0 | 8.42 | -1.38 | 10.3 | 26.33 | 10.92 | 10.92 | 10.92 | 10.92 | 10.92 |
| EBITDA | 669.9 | 685.8 | 669.6 | 693.1 | 885.7 | 1,028.2 | 1,140.4 | 1,265.0 | 1,403.1 | 1,556.3 |
| EBITDA, % | 54.28 | 51.25 | 50.74 | 47.61 | 48.16 | 50.41 | 50.41 | 50.41 | 50.41 | 50.41 |
| Depreciation | 204.7 | 215.7 | 226.8 | 246.3 | 341.9 | 348.4 | 386.4 | 428.6 | 475.4 | 527.3 |
| Depreciation, % | 16.58 | 16.12 | 17.19 | 16.92 | 18.59 | 17.08 | 17.08 | 17.08 | 17.08 | 17.08 |
| EBIT | 465.3 | 470.1 | 442.7 | 446.8 | 543.8 | 679.8 | 754.0 | 836.4 | 927.7 | 1,029.0 |
| EBIT, % | 37.7 | 35.13 | 33.55 | 30.69 | 29.57 | 33.33 | 33.33 | 33.33 | 33.33 | 33.33 |
| Total Cash | 722.6 | 826.4 | 972.1 | 837.8 | 615.4 | 1,162.6 | 1,289.5 | 1,430.3 | 1,586.4 | 1,759.7 |
| Total Cash, percent | .0 | .0 | .0 | .0 | .0 | .0 | .0 | .0 | .0 | .0 |
| Account Receivables | 113.1 | 137.4 | 186.8 | 402.3 | 1,032.0 | 478.7 | 530.9 | 588.9 | 653.2 | 724.5 |
| Account Receivables, % | 9.16 | 10.27 | 14.16 | 27.64 | 56.12 | 23.47 | 23.47 | 23.47 | 23.47 | 23.47 |
| Inventories | 43.7 | 50.8 | 66.8 | 63.1 | 103.2 | 91.1 | 101.1 | 112.1 | 124.4 | 138.0 |
| Inventories, % | 3.54 | 3.79 | 5.06 | 4.33 | 5.61 | 4.47 | 4.47 | 4.47 | 4.47 | 4.47 |
| Accounts Payable | 40.8 | 44.9 | 74.4 | 89.7 | 217.7 | 123.6 | 137.1 | 152.1 | 168.7 | 187.1 |
| Accounts Payable, % | 3.3 | 3.35 | 5.64 | 6.16 | 11.84 | 6.06 | 6.06 | 6.06 | 6.06 | 6.06 |
| Capital Expenditure | -276.9 | -485.0 | -371.7 | -299.8 | -530.6 | -556.0 | -616.7 | -684.1 | -758.8 | -841.6 |
| Capital Expenditure, % | -22.44 | -36.24 | -28.17 | -20.6 | -28.86 | -27.26 | -27.26 | -27.26 | -27.26 | -27.26 |
| Tax Rate, % | 44.19 | 44.19 | 44.19 | 44.19 | 44.19 | 44.19 | 44.19 | 44.19 | 44.19 | 44.19 |
| EBITAT | 400.3 | 393.1 | 354.4 | 259.1 | 303.5 | 494.2 | 548.1 | 608.0 | 674.4 | 748.0 |
| Depreciation | ||||||||||
| Changes in Account Receivables | ||||||||||
| Changes in Inventories | ||||||||||
| Changes in Accounts Payable | ||||||||||
| Capital Expenditure | ||||||||||
| UFCF | 212.0 | 96.5 | 173.6 | 9.1 | -427.2 | 757.9 | 269.1 | 298.5 | 331.1 | 367.2 |
| WACC, % | 6.92 | 6.9 | 6.87 | 6.71 | 6.69 | 6.82 | 6.82 | 6.82 | 6.82 | 6.82 |
| PV UFCF | ||||||||||
| SUM PV UFCF | 1,708.6 | |||||||||
| Long Term Growth Rate, % | 2.00 | |||||||||
| Free cash flow (T + 1) | 375 | |||||||||
| Terminal Value | 7,774 | |||||||||
| Present Terminal Value | 5,590 | |||||||||
| Enterprise Value | 7,298 | |||||||||
| Net Debt | 1,526 | |||||||||
| Equity Value | 5,773 | |||||||||
| Diluted Shares Outstanding, MM | 618 | |||||||||
| Equity Value Per Share | 9.35 |
What You Will Receive
- Authentic Guangdong Shunkong Data: Comprehensive financials – from revenue to EBIT – derived from both actual and projected figures.
- Complete Customizability: Modify all key parameters (highlighted cells) including WACC, growth rates, and tax percentages.
- Immediate Valuation Adjustments: Automatic recalculations to evaluate how changes affect the fair value of Guangdong Shunkong (003039SZ).
- Flexible Excel Template: Designed for quick modifications, scenario analysis, and in-depth forecasting.
- Efficient and Precise: Avoid the hassle of building models from the ground up while ensuring accuracy and adaptability.
Key Features
- Accurate Financial Data for Guangdong Shunkong: Gain access to reliable pre-loaded historical figures and future forecasts.
- Adjustable Forecast Parameters: Customize highlighted cells such as WACC, growth rates, and profit margins.
- Real-Time Calculations: Automatic updates to DCF, Net Present Value (NPV), and cash flow analyses.
- Interactive Visual Dashboard: Clear charts and summaries to help you visualize valuation outcomes.
- Designed for Everyone: A user-friendly layout suitable for investors, CFOs, and consultants alike.
How It Works
- Download the Template: Gain immediate access to the Excel-based GSD DCF Calculator for Guangdong Shunkong Development Co., Ltd. (003039SZ).
- Input Your Assumptions: Modify the yellow-highlighted cells for growth rates, WACC, profit margins, and other key factors.
- Instant Calculations: The model instantly recalculates the intrinsic value of Guangdong Shunkong Development Co., Ltd. (003039SZ).
- Test Scenarios: Experiment with various assumptions to assess potential changes in valuation.
- Analyze and Decide: Utilize the results to inform your investment strategy or financial assessment.
Why Choose Guangdong Shunkong Development Co., Ltd. (003039SZ)?
- Time-Saving: Our solutions eliminate the need to build complex models from the ground up – they're ready to deploy.
- Enhanced Accuracy: Access dependable financial data and formulas to minimize valuation errors.
- Fully Customizable: Adjust the model to align with your specific assumptions and forecasts.
- User-Friendly: Intuitive charts and outputs simplify result interpretation.
- Preferred by Professionals: Crafted for experts who prioritize accuracy and ease of use.
Who Can Benefit from This Product?
- Institutional Investors: Develop comprehensive and accurate valuation models for assessing investment opportunities in Guangdong Shunkong Development Co., Ltd. (003039SZ).
- Corporate Finance Departments: Evaluate various valuation scenarios to inform strategic decisions within the organization.
- Financial Consultants: Deliver precise valuation analyses to clients considering investments in Guangdong Shunkong Development Co., Ltd. (003039SZ).
- Academics and Students: Utilize real market data to enhance learning and practice in financial modeling techniques.
- Industry Analysts: Gain insights into how companies like Guangdong Shunkong Development Co., Ltd. (003039SZ) are assessed in the financial markets.
Contents of the Template
- Pre-Filled Data: Contains Guangdong Shunkong Development Co., Ltd.'s historical financial performance and projections.
- Discounted Cash Flow Model: An editable DCF valuation model with automated calculations.
- Weighted Average Cost of Capital (WACC): A separate sheet for calculating WACC using customized inputs.
- Key Financial Ratios: Assess Guangdong Shunkong’s profitability, efficiency, and financial leverage.
- Customizable Inputs: Easily modify revenue growth, margins, and tax rates.
- Clear Dashboard: Visual representations through charts and tables summarizing essential valuation outcomes.
Disclaimer
All information, articles, and product details provided on this website are for general informational and educational purposes only. We do not claim any ownership over, nor do we intend to infringe upon, any trademarks, copyrights, logos, brand names, or other intellectual property mentioned or depicted on this site. Such intellectual property remains the property of its respective owners, and any references here are made solely for identification or informational purposes, without implying any affiliation, endorsement, or partnership.
We make no representations or warranties, express or implied, regarding the accuracy, completeness, or suitability of any content or products presented. Nothing on this website should be construed as legal, tax, investment, financial, medical, or other professional advice. In addition, no part of this site—including articles or product references—constitutes a solicitation, recommendation, endorsement, advertisement, or offer to buy or sell any securities, franchises, or other financial instruments, particularly in jurisdictions where such activity would be unlawful.
All content is of a general nature and may not address the specific circumstances of any individual or entity. It is not a substitute for professional advice or services. Any actions you take based on the information provided here are strictly at your own risk. You accept full responsibility for any decisions or outcomes arising from your use of this website and agree to release us from any liability in connection with your use of, or reliance upon, the content or products found herein.