
|
United Energy Group Limited (0467.HK) Valoración de DCF |
Completamente Editable: Adáptelo A Sus Necesidades En Excel O Sheets
Diseño Profesional: Plantillas Confiables Y Estándares De La Industria
Predeterminadas Para Un Uso Rápido Y Eficiente
Compatible con MAC / PC, completamente desbloqueado
No Se Necesita Experiencia; Fáciles De Seguir
United Energy Group Limited (0467.HK) Bundle
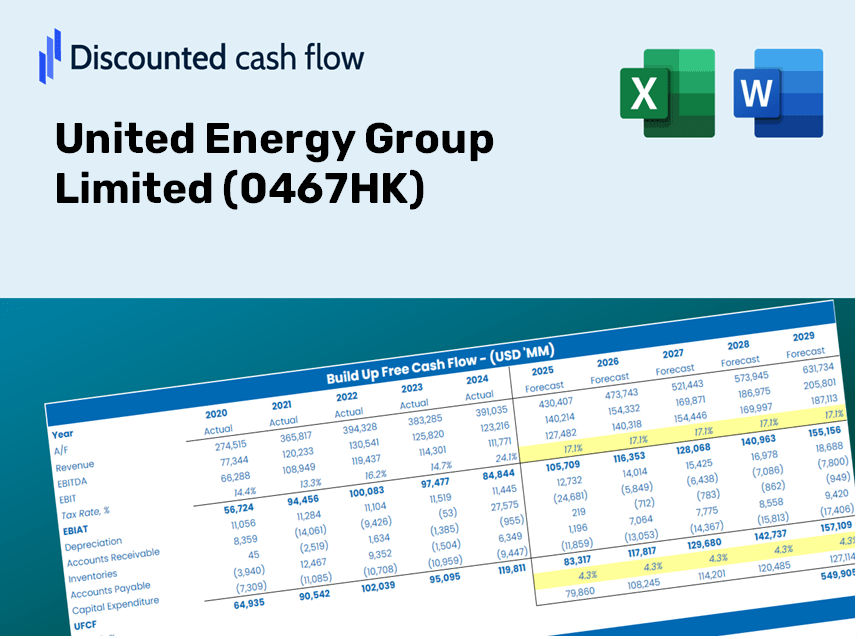
¡Simplifique la valoración de United Energy Group Limited (0467HK) con esta calculadora DCF personalizable! Con Real United Energy Group Limited (0467HK) financieras y entradas de pronóstico ajustables, puede probar escenarios y descubrir el valor razonable de United Energy Group Limited (0467HK) en minutos.
Discounted Cash Flow (DCF) - (USD MM)
| Year | AY1 2020 |
AY2 2021 |
AY3 2022 |
AY4 2023 |
AY5 2024 |
FY1 2025 |
FY2 2026 |
FY3 2027 |
FY4 2028 |
FY5 2029 |
|---|---|---|---|---|---|---|---|---|---|---|
| Revenue | 6,204.2 | 7,436.9 | 10,753.7 | 13,591.1 | 17,522.9 | 22,770.3 | 29,588.9 | 38,449.5 | 49,963.4 | 64,925.3 |
| Revenue Growth, % | 0 | 19.87 | 44.6 | 26.38 | 28.93 | 29.95 | 29.95 | 29.95 | 29.95 | 29.95 |
| EBITDA | 4,143.5 | 5,730.9 | 7,747.8 | 3,001.8 | 7,105.9 | 12,684.5 | 16,482.9 | 21,418.8 | 27,832.8 | 36,167.5 |
| EBITDA, % | 66.79 | 77.06 | 72.05 | 22.09 | 40.55 | 55.71 | 55.71 | 55.71 | 55.71 | 55.71 |
| Depreciation | 2,845.7 | 2,983.4 | 4,172.4 | 4,732.4 | 5,083.5 | 8,589.6 | 11,161.8 | 14,504.2 | 18,847.6 | 24,491.6 |
| Depreciation, % | 45.87 | 40.12 | 38.8 | 34.82 | 29.01 | 37.72 | 37.72 | 37.72 | 37.72 | 37.72 |
| EBIT | 1,297.7 | 2,747.6 | 3,575.4 | -1,730.6 | 2,022.4 | 4,094.9 | 5,321.1 | 6,914.6 | 8,985.2 | 11,675.8 |
| EBIT, % | 20.92 | 36.94 | 33.25 | -12.73 | 11.54 | 17.98 | 17.98 | 17.98 | 17.98 | 17.98 |
| Total Cash | 2,771.8 | 3,263.0 | 3,171.5 | 3,330.0 | 3,319.1 | 7,354.2 | 9,556.4 | 12,418.2 | 16,136.8 | 20,969.1 |
| Total Cash, percent | .0 | .0 | .0 | .0 | .0 | .0 | .0 | .0 | .0 | .0 |
| Account Receivables | 3,660.0 | 4,196.8 | 6,349.4 | 8,067.3 | 6,022.2 | 12,213.6 | 15,871.0 | 20,623.7 | 26,799.6 | 34,824.9 |
| Account Receivables, % | 58.99 | 56.43 | 59.04 | 59.36 | 34.37 | 53.64 | 53.64 | 53.64 | 53.64 | 53.64 |
| Inventories | 331.4 | 287.2 | 389.3 | 252.6 | 257.9 | 735.7 | 956.0 | 1,242.3 | 1,614.3 | 2,097.6 |
| Inventories, % | 5.34 | 3.86 | 3.62 | 1.86 | 1.47 | 3.23 | 3.23 | 3.23 | 3.23 | 3.23 |
| Accounts Payable | 475.1 | 281.3 | 606.6 | 1,118.0 | 8,794.4 | 3,438.1 | 4,467.7 | 5,805.5 | 7,544.0 | 9,803.1 |
| Accounts Payable, % | 7.66 | 3.78 | 5.64 | 8.23 | 50.19 | 15.1 | 15.1 | 15.1 | 15.1 | 15.1 |
| Capital Expenditure | -1,893.2 | -2,735.5 | -5,726.1 | -6,678.0 | -6,295.5 | -9,363.4 | -12,167.4 | -15,810.9 | -20,545.6 | -26,698.1 |
| Capital Expenditure, % | -30.51 | -36.78 | -53.25 | -49.14 | -35.93 | -41.12 | -41.12 | -41.12 | -41.12 | -41.12 |
| Tax Rate, % | -6.8 | -6.8 | -6.8 | -6.8 | -6.8 | -6.8 | -6.8 | -6.8 | -6.8 | -6.8 |
| EBITAT | 1,092.3 | 2,259.4 | 3,078.4 | -1,462.8 | 2,159.8 | 3,579.1 | 4,650.9 | 6,043.7 | 7,853.5 | 10,205.3 |
| Depreciation | ||||||||||
| Changes in Account Receivables | ||||||||||
| Changes in Inventories | ||||||||||
| Changes in Accounts Payable | ||||||||||
| Capital Expenditure | ||||||||||
| UFCF | -1,471.5 | 1,821.0 | -404.6 | -4,478.2 | 10,664.1 | -9,220.3 | 797.2 | 1,035.9 | 1,346.1 | 1,749.2 |
| WACC, % | 7.2 | 7.15 | 7.25 | 7.21 | 7.62 | 7.29 | 7.29 | 7.29 | 7.29 | 7.29 |
| PV UFCF | ||||||||||
| SUM PV UFCF | -4,816.0 | |||||||||
| Long Term Growth Rate, % | 2.00 | |||||||||
| Free cash flow (T + 1) | 1,784 | |||||||||
| Terminal Value | 33,748 | |||||||||
| Present Terminal Value | 23,742 | |||||||||
| Enterprise Value | 18,926 | |||||||||
| Net Debt | -2,406 | |||||||||
| Equity Value | 21,332 | |||||||||
| Diluted Shares Outstanding, MM | 25,802 | |||||||||
| Equity Value Per Share | 0.83 |
What You Will Receive
- Authentic United Energy Data: Comprehensive financials – from revenue to EBIT – derived from both actual results and projected estimates.
- Complete Customization: Modify all essential parameters (highlighted cells) such as WACC, growth rates, and tax percentages.
- Instant Valuation Adjustments: Automatic recalculations to assess the effects of changes on the fair value of United Energy Group Limited (0467HK).
- Flexible Excel Template: Designed for easy modifications, scenario analyses, and thorough projections.
- Efficient and Accurate: Eliminate the need to create models from the ground up while ensuring precision and adaptability.
Key Features
- Real-Time Financial Data: Gain access to precise, pre-loaded historical results and forward-looking projections for United Energy Group Limited (0467HK).
- Tailored Forecast Assumptions: Adjust the yellow-highlighted fields to modify WACC, growth rates, and profit margins according to your analysis.
- Automated Calculations: Enjoy real-time updates for DCF, Net Present Value (NPV), and cash flow evaluations.
- User-Friendly Dashboard: Clear and concise charts and summaries to help you visualize your valuation outcomes.
- Suited for All Skill Levels: An intuitive and straightforward layout designed for investors, CFOs, and consultants alike.
How It Functions
- 1. Access the Template: Download and open the Excel file containing United Energy Group Limited's (0467HK) preloaded data.
- 2. Modify Assumptions: Adjust key variables such as growth rates, WACC, and capital expenditures.
- 3. View Results Immediately: The DCF model updates in real-time to calculate intrinsic value and NPV.
- 4. Explore Scenarios: Evaluate various forecasts to understand different valuation results.
- 5. Present with Assurance: Deliver professional valuation insights to enhance your decision-making.
Why Opt for This Calculator?
- Precision: Utilizes authentic United Energy Group Limited (0467HK) financials for reliable data.
- Versatility: Engineered for users to freely experiment with and adjust inputs.
- Efficiency: Eliminate the need to create a DCF model from the ground up.
- Top-Tier Quality: Crafted with the expertise and usability requirements of CFOs in mind.
- Intuitive Design: Simple to navigate, making it accessible for users without extensive financial modeling skills.
Who Should Benefit from This Product?
- Individual Investors: Make well-informed choices regarding the purchase or sale of United Energy Group Limited (0467HK) stock.
- Financial Analysts: Enhance valuation tasks with readily available financial models tailored for United Energy Group Limited (0467HK).
- Consultants: Provide clients with precise and timely valuation insights related to United Energy Group Limited (0467HK).
- Business Owners: Gain an understanding of how major companies like United Energy Group Limited (0467HK) are valued to inform your strategic decisions.
- Finance Students: Explore valuation methodologies using real-life data and examples from United Energy Group Limited (0467HK).
Contents of the Template
- Pre-Filled Data: Contains United Energy Group Limited's historical financials and projections.
- Discounted Cash Flow Model: An editable DCF valuation model featuring automatic calculations.
- Weighted Average Cost of Capital (WACC): A specialized sheet for WACC calculations based on user-defined inputs.
- Key Financial Ratios: Evaluate United Energy Group Limited's profitability, efficiency, and leverage metrics.
- Customizable Inputs: Easily modify revenue growth, margins, and tax rates.
- User-Friendly Dashboard: Visual charts and tables that summarize essential valuation outcomes.
Disclaimer
All information, articles, and product details provided on this website are for general informational and educational purposes only. We do not claim any ownership over, nor do we intend to infringe upon, any trademarks, copyrights, logos, brand names, or other intellectual property mentioned or depicted on this site. Such intellectual property remains the property of its respective owners, and any references here are made solely for identification or informational purposes, without implying any affiliation, endorsement, or partnership.
We make no representations or warranties, express or implied, regarding the accuracy, completeness, or suitability of any content or products presented. Nothing on this website should be construed as legal, tax, investment, financial, medical, or other professional advice. In addition, no part of this site—including articles or product references—constitutes a solicitation, recommendation, endorsement, advertisement, or offer to buy or sell any securities, franchises, or other financial instruments, particularly in jurisdictions where such activity would be unlawful.
All content is of a general nature and may not address the specific circumstances of any individual or entity. It is not a substitute for professional advice or services. Any actions you take based on the information provided here are strictly at your own risk. You accept full responsibility for any decisions or outcomes arising from your use of this website and agree to release us from any liability in connection with your use of, or reliance upon, the content or products found herein.