
|
Dongfeng Motor Group Company Limited (0489.HK) Valoración de DCF |
Completamente Editable: Adáptelo A Sus Necesidades En Excel O Sheets
Diseño Profesional: Plantillas Confiables Y Estándares De La Industria
Predeterminadas Para Un Uso Rápido Y Eficiente
Compatible con MAC / PC, completamente desbloqueado
No Se Necesita Experiencia; Fáciles De Seguir
Dongfeng Motor Group Company Limited (0489.HK) Bundle
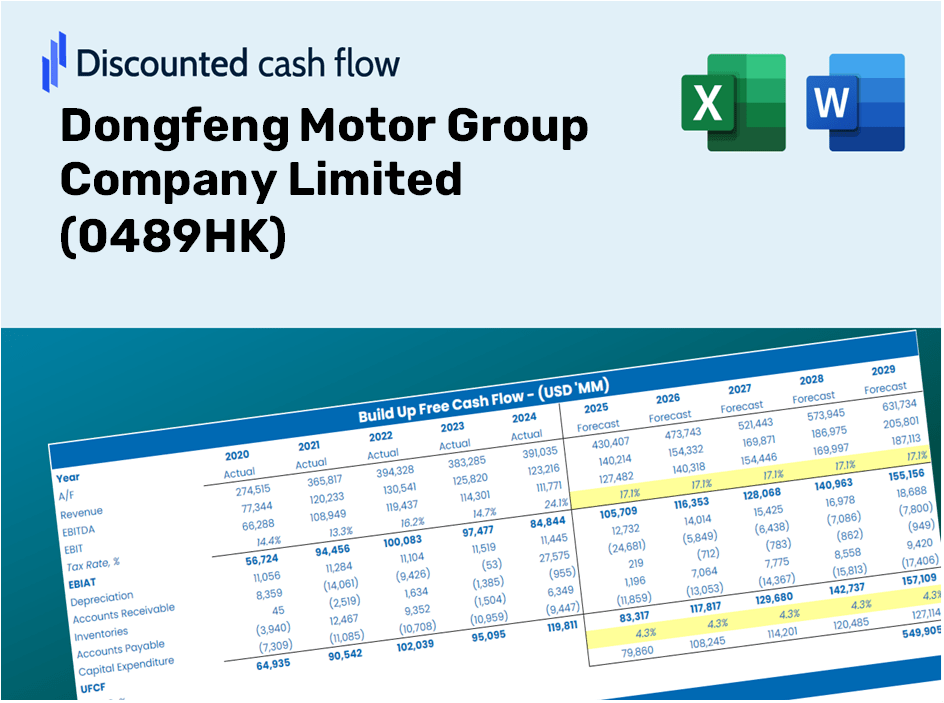
¡Simplifique la valoración limitada de Dongfeng Motor Group Company con esta calculadora DCF personalizable! Con Real Dongfeng Motor Group Company Limited Financials e insumos de pronóstico ajustables, puede probar escenarios y descubrir Dongfeng Motor Group Company Limited Fair Value en minutos.
Discounted Cash Flow (DCF) - (USD MM)
| Year | AY1 2020 |
AY2 2021 |
AY3 2022 |
AY4 2023 |
AY5 2024 |
FY1 2025 |
FY2 2026 |
FY3 2027 |
FY4 2028 |
FY5 2029 |
|---|---|---|---|---|---|---|---|---|---|---|
| Revenue | 118,566.6 | 123,735.0 | 101,315.3 | 108,588.5 | 116,113.1 | 116,214.1 | 116,315.3 | 116,416.5 | 116,517.8 | 116,619.2 |
| Revenue Growth, % | 0 | 4.36 | -18.12 | 7.18 | 6.93 | 0.08703524 | 0.08703524 | 0.08703524 | 0.08703524 | 0.08703524 |
| EBITDA | 1,054.0 | -1,411.5 | -6,022.3 | -441.7 | -4,002.8 | -2,335.9 | -2,338.0 | -2,340.0 | -2,342.0 | -2,344.1 |
| EBITDA, % | 0.88896 | -1.14 | -5.94 | -0.40679 | -3.45 | -2.01 | -2.01 | -2.01 | -2.01 | -2.01 |
| Depreciation | 3,546.9 | 4,303.5 | 4,855.7 | 5,696.5 | 5,225.2 | 4,882.9 | 4,887.1 | 4,891.4 | 4,895.7 | 4,899.9 |
| Depreciation, % | 2.99 | 3.48 | 4.79 | 5.25 | 4.5 | 4.2 | 4.2 | 4.2 | 4.2 | 4.2 |
| EBIT | -2,492.9 | -5,715.1 | -10,878.0 | -6,138.2 | -9,228.1 | -7,218.8 | -7,225.1 | -7,231.4 | -7,237.7 | -7,244.0 |
| EBIT, % | -2.1 | -4.62 | -10.74 | -5.65 | -7.95 | -6.21 | -6.21 | -6.21 | -6.21 | -6.21 |
| Total Cash | 83,866.2 | 86,801.9 | 103,018.8 | 114,927.8 | 105,583.9 | 100,366.4 | 100,453.8 | 100,541.2 | 100,628.7 | 100,716.3 |
| Total Cash, percent | .0 | .0 | .0 | .0 | .0 | .0 | .0 | .0 | .0 | .0 |
| Account Receivables | 13,060.4 | 5,954.5 | 17,641.6 | .0 | 61,329.5 | 20,002.5 | 20,019.9 | 20,037.4 | 20,054.8 | 20,072.2 |
| Account Receivables, % | 11.02 | 4.81 | 17.41 | 0 | 52.82 | 17.21 | 17.21 | 17.21 | 17.21 | 17.21 |
| Inventories | 14,036.7 | 12,706.1 | 14,358.2 | 15,563.1 | 16,806.3 | 15,127.7 | 15,140.9 | 15,154.1 | 15,167.2 | 15,180.4 |
| Inventories, % | 11.84 | 10.27 | 14.17 | 14.33 | 14.47 | 13.02 | 13.02 | 13.02 | 13.02 | 13.02 |
| Accounts Payable | 63,538.2 | 52,866.8 | 45,273.3 | 61,727.5 | 61,885.0 | 58,372.6 | 58,423.4 | 58,474.3 | 58,525.2 | 58,576.1 |
| Accounts Payable, % | 53.59 | 42.73 | 44.69 | 56.85 | 53.3 | 50.23 | 50.23 | 50.23 | 50.23 | 50.23 |
| Capital Expenditure | -4,403.0 | -5,044.8 | -4,557.2 | -13,908.8 | .0 | -5,833.3 | -5,838.4 | -5,843.5 | -5,848.6 | -5,853.7 |
| Capital Expenditure, % | -3.71 | -4.08 | -4.5 | -12.81 | 0 | -5.02 | -5.02 | -5.02 | -5.02 | -5.02 |
| Tax Rate, % | 104.99 | 104.99 | 104.99 | 104.99 | 104.99 | 104.99 | 104.99 | 104.99 | 104.99 | 104.99 |
| EBITAT | -2,200.6 | -5,100.4 | -13,318.5 | -3,841.5 | 460.2 | -4,910.3 | -4,914.6 | -4,918.8 | -4,923.1 | -4,927.4 |
| Depreciation | ||||||||||
| Changes in Account Receivables | ||||||||||
| Changes in Inventories | ||||||||||
| Changes in Accounts Payable | ||||||||||
| Capital Expenditure | ||||||||||
| UFCF | 33,384.4 | -8,076.6 | -33,952.7 | 20,837.0 | -56,729.8 | 33,632.5 | -5,845.6 | -5,850.7 | -5,855.8 | -5,860.9 |
| WACC, % | 5.58 | 5.6 | 5.83 | 5.03 | 3.69 | 5.15 | 5.15 | 5.15 | 5.15 | 5.15 |
| PV UFCF | ||||||||||
| SUM PV UFCF | 12,316.0 | |||||||||
| Long Term Growth Rate, % | 2.00 | |||||||||
| Free cash flow (T + 1) | -5,978 | |||||||||
| Terminal Value | -189,806 | |||||||||
| Present Terminal Value | -147,663 | |||||||||
| Enterprise Value | -135,347 | |||||||||
| Net Debt | -20,698 | |||||||||
| Equity Value | -114,650 | |||||||||
| Diluted Shares Outstanding, MM | 8,260 | |||||||||
| Equity Value Per Share | -13.88 |
What You Will Receive
- Customizable Excel Template: A fully adjustable Excel-based DCF Calculator featuring pre-populated financial data for Dongfeng Motor Group Company Limited (0489HK).
- Authentic Data: Access to historical performance metrics and forward-looking projections (highlighted in the yellow cells).
- Flexible Forecasting: Adjust key assumptions such as revenue growth, EBITDA percentage, and WACC.
- Instant Calculations: Immediately observe how your inputs affect the valuation of Dongfeng Motor Group Company Limited (0489HK).
- Professional Resource: Designed for investors, CFOs, consultants, and financial analysts.
- User-Friendly Interface: Organized for simplicity and efficiency, complete with detailed instructions.
Key Features
- Comprehensive DFMC Data: Pre-populated with Dongfeng Motor Group's historical financials and future projections.
- Fully Customizable Parameters: Tailor revenue growth rates, profit margins, WACC, tax assumptions, and capital expenditures.
- Interactive Valuation Model: Real-time updates for Net Present Value (NPV) and intrinsic value based on your configurations.
- Scenario Analysis: Build various forecasting scenarios to evaluate a range of valuation possibilities.
- Intuitive User Experience: Clean, organized layout designed for both seasoned professionals and newcomers.
How It Operates
- Step 1: Download the Excel spreadsheet.
- Step 2: Examine the pre-filled data for Dongfeng Motor Group Company Limited (0489HK) covering both historical and forecasted figures.
- Step 3: Modify key assumptions (highlighted in yellow) as per your analysis.
- Step 4: Observe the automatic updates for the intrinsic value of Dongfeng Motor Group Company Limited (0489HK).
- Step 5: Utilize the results for your investment strategies or financial reporting.
Why Opt for This Calculator?
- Designed for Professionals: A sophisticated tool utilized by analysts, CFOs, and consultants.
- Accurate Financial Data: Dongfeng Motor Group’s historical and projected financials preloaded for precision.
- Flexible Scenario Testing: Effortlessly simulate various forecasts and assumptions.
- Clear Outputs: Instantly calculates intrinsic value, NPV, and essential metrics.
- User-Friendly: Step-by-step guidance to navigate you through the process.
Who Should Consider This Product?
- Individual Investors: Make educated choices regarding purchasing or selling Dongfeng Motor Group Company Limited (0489HK) shares.
- Financial Analysts: Enhance valuation workflows with easy-to-implement financial models.
- Consultants: Provide clients with timely and precise valuation insights based on Dongfeng Motor Group Company Limited (0489HK).
- Business Owners: Gain insights into how major corporations like Dongfeng Motor Group Company Limited (0489HK) are valued to inform your own strategic decisions.
- Finance Students: Acquire valuation skills using real-world examples and data related to Dongfeng Motor Group Company Limited (0489HK).
Overview of Template Features
- Pre-Filled Data: Contains Dongfeng Motor Group's historical financials and projections.
- Discounted Cash Flow Model: An editable DCF valuation model with automated calculations.
- Weighted Average Cost of Capital (WACC): A specific sheet for WACC calculation based on user-defined inputs.
- Key Financial Ratios: Evaluate Dongfeng Motor Group's profitability, efficiency, and leverage metrics.
- Customizable Inputs: Easily adjust revenue growth, profit margins, and tax rates.
- User-Friendly Dashboard: Visuals and tables that summarize essential valuation outputs.
Disclaimer
All information, articles, and product details provided on this website are for general informational and educational purposes only. We do not claim any ownership over, nor do we intend to infringe upon, any trademarks, copyrights, logos, brand names, or other intellectual property mentioned or depicted on this site. Such intellectual property remains the property of its respective owners, and any references here are made solely for identification or informational purposes, without implying any affiliation, endorsement, or partnership.
We make no representations or warranties, express or implied, regarding the accuracy, completeness, or suitability of any content or products presented. Nothing on this website should be construed as legal, tax, investment, financial, medical, or other professional advice. In addition, no part of this site—including articles or product references—constitutes a solicitation, recommendation, endorsement, advertisement, or offer to buy or sell any securities, franchises, or other financial instruments, particularly in jurisdictions where such activity would be unlawful.
All content is of a general nature and may not address the specific circumstances of any individual or entity. It is not a substitute for professional advice or services. Any actions you take based on the information provided here are strictly at your own risk. You accept full responsibility for any decisions or outcomes arising from your use of this website and agree to release us from any liability in connection with your use of, or reliance upon, the content or products found herein.