
|
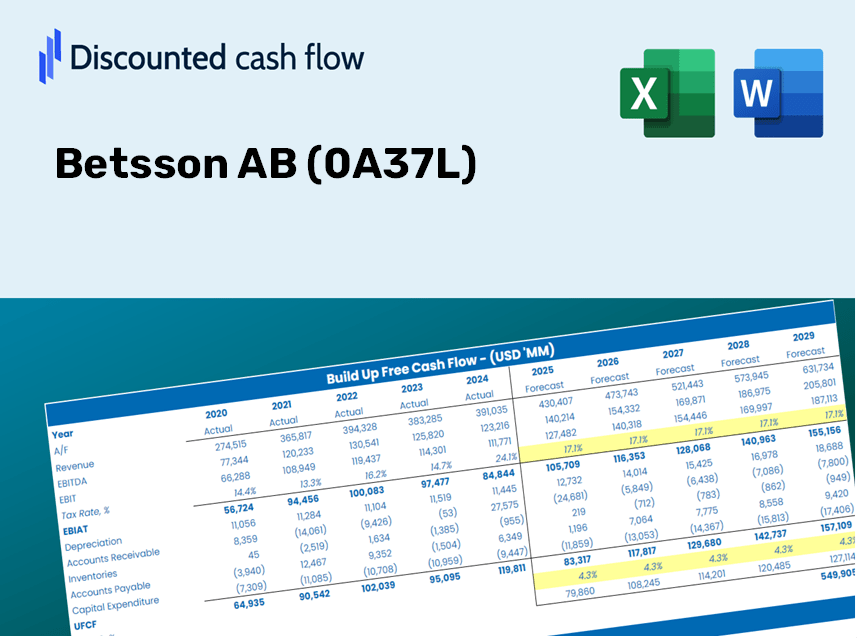
Betsson AB (0a37.l) Valoración de DCF |
Completamente Editable: Adáptelo A Sus Necesidades En Excel O Sheets
Diseño Profesional: Plantillas Confiables Y Estándares De La Industria
Predeterminadas Para Un Uso Rápido Y Eficiente
Compatible con MAC / PC, completamente desbloqueado
No Se Necesita Experiencia; Fáciles De Seguir
Betsson AB (0A37.L) Bundle
¡Mejore sus estrategias de inversión con la calculadora DCF Betsson AB (0A37L)! Explore los datos financieros de Betsson auténticos, ajuste las predicciones y gastos de crecimiento, y observe instantáneamente cómo estas modificaciones afectan el valor intrínseco de Betsson AB.
Discounted Cash Flow (DCF) - (USD MM)
| Year | AY1 2020 |
AY2 2021 |
AY3 2022 |
AY4 2023 |
AY5 2024 |
FY1 2025 |
FY2 2026 |
FY3 2027 |
FY4 2028 |
FY5 2029 |
|---|---|---|---|---|---|---|---|---|---|---|
| Revenue | 6,966.2 | 7,234.7 | 8,549.1 | 10,430.1 | 12,172.5 | 14,020.6 | 16,149.3 | 18,601.1 | 21,425.3 | 24,678.2 |
| Revenue Growth, % | 0 | 3.85 | 18.17 | 22 | 16.71 | 15.18 | 15.18 | 15.18 | 15.18 | 15.18 |
| EBITDA | 1,605.9 | 1,677.4 | 1,903.8 | 2,857.6 | 3,476.0 | 3,490.0 | 4,019.9 | 4,630.2 | 5,333.2 | 6,142.9 |
| EBITDA, % | 23.05 | 23.18 | 22.27 | 27.4 | 28.56 | 24.89 | 24.89 | 24.89 | 24.89 | 24.89 |
| Depreciation | 391.5 | 397.2 | 453.3 | 573.8 | 651.2 | 764.5 | 880.6 | 1,014.3 | 1,168.3 | 1,345.7 |
| Depreciation, % | 5.62 | 5.49 | 5.3 | 5.5 | 5.35 | 5.45 | 5.45 | 5.45 | 5.45 | 5.45 |
| EBIT | 1,214.3 | 1,280.2 | 1,450.5 | 2,283.8 | 2,824.8 | 2,725.5 | 3,139.3 | 3,615.9 | 4,164.9 | 4,797.2 |
| EBIT, % | 17.43 | 17.7 | 16.97 | 21.9 | 23.21 | 19.44 | 19.44 | 19.44 | 19.44 | 19.44 |
| Total Cash | 941.1 | 1,051.6 | 1,851.3 | 2,608.1 | 3,393.5 | 2,876.5 | 3,313.3 | 3,816.3 | 4,395.7 | 5,063.1 |
| Total Cash, percent | .0 | .0 | .0 | .0 | .0 | .0 | .0 | .0 | .0 | .0 |
| Account Receivables | 639.3 | 651.8 | 625.0 | 530.0 | 638.3 | 1,004.5 | 1,157.0 | 1,332.7 | 1,535.0 | 1,768.1 |
| Account Receivables, % | 9.18 | 9.01 | 7.31 | 5.08 | 5.24 | 7.16 | 7.16 | 7.16 | 7.16 | 7.16 |
| Inventories | .0 | 1,283.6 | .0 | .0 | .0 | 497.5 | 573.0 | 660.0 | 760.2 | 875.7 |
| Inventories, % | 0 | 17.74 | 0 | 0 | 0 | 3.55 | 3.55 | 3.55 | 3.55 | 3.55 |
| Accounts Payable | 76.6 | 151.8 | 195.8 | 167.2 | 268.4 | 260.7 | 300.3 | 345.8 | 398.4 | 458.8 |
| Accounts Payable, % | 1.1 | 2.1 | 2.29 | 1.6 | 2.2 | 1.86 | 1.86 | 1.86 | 1.86 | 1.86 |
| Capital Expenditure | -398.7 | -353.1 | -390.5 | -455.4 | -550.0 | -674.6 | -777.0 | -895.0 | -1,030.8 | -1,187.3 |
| Capital Expenditure, % | -5.72 | -4.88 | -4.57 | -4.37 | -4.52 | -4.81 | -4.81 | -4.81 | -4.81 | -4.81 |
| Tax Rate, % | 22.42 | 22.42 | 22.42 | 22.42 | 22.42 | 22.42 | 22.42 | 22.42 | 22.42 | 22.42 |
| EBITAT | 1,143.6 | 1,216.2 | 1,392.3 | 2,078.6 | 2,191.4 | 2,473.4 | 2,848.9 | 3,281.5 | 3,779.7 | 4,353.5 |
| Depreciation | ||||||||||
| Changes in Account Receivables | ||||||||||
| Changes in Inventories | ||||||||||
| Changes in Accounts Payable | ||||||||||
| Capital Expenditure | ||||||||||
| UFCF | 573.7 | 39.3 | 2,809.5 | 2,263.5 | 2,285.5 | 1,691.9 | 2,764.1 | 3,183.7 | 3,667.1 | 4,223.8 |
| WACC, % | 6.75 | 6.75 | 6.77 | 6.71 | 6.56 | 6.71 | 6.71 | 6.71 | 6.71 | 6.71 |
| PV UFCF | ||||||||||
| SUM PV UFCF | 12,515.1 | |||||||||
| Long Term Growth Rate, % | 2.00 | |||||||||
| Free cash flow (T + 1) | 4,308 | |||||||||
| Terminal Value | 91,537 | |||||||||
| Present Terminal Value | 66,166 | |||||||||
| Enterprise Value | 78,681 | |||||||||
| Net Debt | -1,345 | |||||||||
| Equity Value | 80,027 | |||||||||
| Diluted Shares Outstanding, MM | 139 | |||||||||
| Equity Value Per Share | 577.69 |
What You Will Receive
- Authentic BETSSON Financial Data: Pre-loaded with historical and forecasted data for accurate analysis.
- Completely Customizable Template: Easily adjust key parameters such as revenue growth, WACC, and EBITDA percentage.
- Instant Calculations: Watch as BETSSON's intrinsic value updates in real-time with your modifications.
- Advanced Valuation Tool: Tailored for investors, analysts, and consultants in search of precise DCF outcomes.
- Intuitive Design: User-friendly layout and straightforward guidelines suitable for all skill levels.
Key Features
- Real-Time Betsson Data: Comes pre-loaded with Betsson AB's historical financial performance and future forecasts.
- Completely Customizable Inputs: Modify parameters such as revenue growth, profit margins, WACC, tax rates, and capital expenditures to fit your analysis.
- Interactive Valuation Model: Automatically recalculates Net Present Value (NPV) and intrinsic value in response to user-defined inputs.
- Scenario Analysis: Generate various forecasting scenarios to explore different valuation possibilities.
- Intuitive User Interface: Designed to be accessible and straightforward for both industry experts and novices.
How It Works
- 1. Access the Template: Download and open the Excel file containing Betsson AB's (0A37L) preloaded data.
- 2. Adjust Assumptions: Modify essential inputs such as growth rates, WACC, and capital expenditures.
- 3. See Results in Real-Time: The DCF model automatically calculates intrinsic value and NPV.
- 4. Explore Different Scenarios: Analyze various forecasts to evaluate different valuation possibilities.
- 5. Make Informed Decisions: Present professional valuation insights to bolster your strategic choices.
Why Opt for the Betsson AB (0A37L) Calculator?
- Precision: Leverages accurate Betsson financial data for reliable results.
- Adaptability: Built for users to easily experiment with and adjust inputs.
- Efficiency: Eliminate the need to create a financial model from the ground up.
- Expert-Level: Crafted with the precision and functionality expected at the CFO level.
- User-Friendly: Intuitive interface suitable for individuals with limited financial modeling skills.
Who Should Use This Product?
- Investors: Evaluate Betsson AB’s (0A37L) valuation before making investment decisions.
- CFOs and Financial Analysts: Optimize valuation methods and assess financial forecasts for Betsson AB.
- Startup Founders: Discover the valuation strategies of established companies like Betsson AB (0A37L).
- Consultants: Provide comprehensive valuation reports for clients in the gaming industry.
- Students and Educators: Utilize real-world examples to practice and instruct on valuation techniques related to Betsson AB (0A37L).
What the Template Includes
- Pre-Filled Data: Contains Betsson AB's historical financials and projections.
- Discounted Cash Flow Model: An editable DCF valuation model featuring automatic calculations.
- Weighted Average Cost of Capital (WACC): A specific sheet designed for WACC calculations based on user-defined inputs.
- Key Financial Ratios: Assess Betsson AB's profitability, efficiency, and leverage metrics.
- Customizable Inputs: Easily modify revenue growth rates, profit margins, and tax percentages.
- Clear Dashboard: Visualizations and tables summarizing essential valuation outcomes.
Disclaimer
All information, articles, and product details provided on this website are for general informational and educational purposes only. We do not claim any ownership over, nor do we intend to infringe upon, any trademarks, copyrights, logos, brand names, or other intellectual property mentioned or depicted on this site. Such intellectual property remains the property of its respective owners, and any references here are made solely for identification or informational purposes, without implying any affiliation, endorsement, or partnership.
We make no representations or warranties, express or implied, regarding the accuracy, completeness, or suitability of any content or products presented. Nothing on this website should be construed as legal, tax, investment, financial, medical, or other professional advice. In addition, no part of this site—including articles or product references—constitutes a solicitation, recommendation, endorsement, advertisement, or offer to buy or sell any securities, franchises, or other financial instruments, particularly in jurisdictions where such activity would be unlawful.
All content is of a general nature and may not address the specific circumstances of any individual or entity. It is not a substitute for professional advice or services. Any actions you take based on the information provided here are strictly at your own risk. You accept full responsibility for any decisions or outcomes arising from your use of this website and agree to release us from any liability in connection with your use of, or reliance upon, the content or products found herein.