
|
AF Gruppen ASA (0DH7.L) Valoración de DCF |
Completamente Editable: Adáptelo A Sus Necesidades En Excel O Sheets
Diseño Profesional: Plantillas Confiables Y Estándares De La Industria
Predeterminadas Para Un Uso Rápido Y Eficiente
Compatible con MAC / PC, completamente desbloqueado
No Se Necesita Experiencia; Fáciles De Seguir
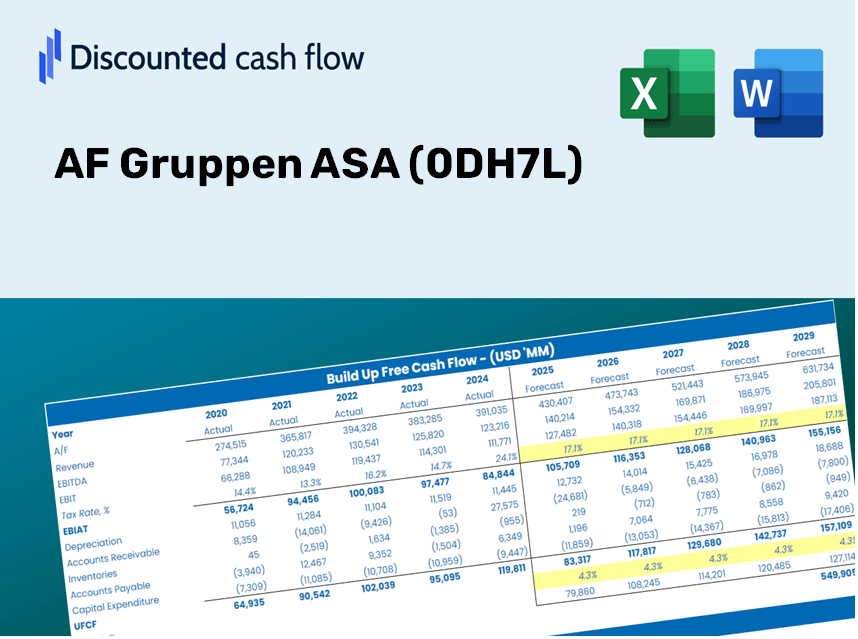
AF Gruppen ASA (0DH7.L) Bundle
¡Mejore sus estrategias de inversión con la calculadora DCF AF Gruppen ASA (0DH7L)! Explore datos financieros reales, ajuste las proyecciones y gastos de crecimiento, y observe instantáneamente cómo estos ajustes afectan el valor intrínseco de AF Gruppen ASA (0DH7L).
Discounted Cash Flow (DCF) - (USD MM)
| Year | AY1 2020 |
AY2 2021 |
AY3 2022 |
AY4 2023 |
AY5 2024 |
FY1 2025 |
FY2 2026 |
FY3 2027 |
FY4 2028 |
FY5 2029 |
|---|---|---|---|---|---|---|---|---|---|---|
| Revenue | 26,944.0 | 27,751.0 | 30,970.0 | 30,530.0 | 30,222.0 | 32,273.6 | 34,464.5 | 36,804.1 | 39,302.5 | 41,970.5 |
| Revenue Growth, % | 0 | 3 | 11.6 | -1.42 | -1.01 | 6.79 | 6.79 | 6.79 | 6.79 | 6.79 |
| EBITDA | 1,855.0 | 2,082.0 | 1,836.0 | 1,291.0 | 1,861.0 | 1,981.7 | 2,116.2 | 2,259.9 | 2,413.3 | 2,577.1 |
| EBITDA, % | 6.88 | 7.5 | 5.93 | 4.23 | 6.16 | 6.14 | 6.14 | 6.14 | 6.14 | 6.14 |
| Depreciation | 570.0 | 566.0 | 524.0 | 576.0 | 697.0 | 648.1 | 692.0 | 739.0 | 789.2 | 842.8 |
| Depreciation, % | 2.12 | 2.04 | 1.69 | 1.89 | 2.31 | 2.01 | 2.01 | 2.01 | 2.01 | 2.01 |
| EBIT | 1,285.0 | 1,516.0 | 1,312.0 | 715.0 | 1,164.0 | 1,333.7 | 1,424.2 | 1,520.9 | 1,624.1 | 1,734.4 |
| EBIT, % | 4.77 | 5.46 | 4.24 | 2.34 | 3.85 | 4.13 | 4.13 | 4.13 | 4.13 | 4.13 |
| Total Cash | 665.0 | 634.0 | 765.0 | 347.0 | 1,034.0 | 760.4 | 812.0 | 867.2 | 926.0 | 988.9 |
| Total Cash, percent | .0 | .0 | .0 | .0 | .0 | .0 | .0 | .0 | .0 | .0 |
| Account Receivables | 3,837.0 | 4,592.0 | 5,419.0 | 4,937.0 | 4,384.0 | 5,096.8 | 5,442.8 | 5,812.3 | 6,206.8 | 6,628.2 |
| Account Receivables, % | 14.24 | 16.55 | 17.5 | 16.17 | 14.51 | 15.79 | 15.79 | 15.79 | 15.79 | 15.79 |
| Inventories | 360.0 | 249.0 | 460.0 | 633.0 | 761.0 | 536.4 | 572.8 | 611.7 | 653.2 | 697.6 |
| Inventories, % | 1.34 | 0.89726 | 1.49 | 2.07 | 2.52 | 1.66 | 1.66 | 1.66 | 1.66 | 1.66 |
| Accounts Payable | 3,150.0 | 3,353.0 | 3,755.0 | 4,182.0 | 3,735.0 | 3,999.0 | 4,270.5 | 4,560.4 | 4,869.9 | 5,200.5 |
| Accounts Payable, % | 11.69 | 12.08 | 12.12 | 13.7 | 12.36 | 12.39 | 12.39 | 12.39 | 12.39 | 12.39 |
| Capital Expenditure | -219.0 | -207.0 | -291.0 | -535.0 | -255.0 | -328.8 | -351.2 | -375.0 | -400.5 | -427.6 |
| Capital Expenditure, % | -0.8128 | -0.74592 | -0.93962 | -1.75 | -0.84376 | -1.02 | -1.02 | -1.02 | -1.02 | -1.02 |
| Tax Rate, % | 34.75 | 34.75 | 34.75 | 34.75 | 34.75 | 34.75 | 34.75 | 34.75 | 34.75 | 34.75 |
| EBITAT | 862.3 | 977.7 | 897.8 | 410.6 | 759.6 | 860.8 | 919.2 | 981.6 | 1,048.2 | 1,119.4 |
| Depreciation | ||||||||||
| Changes in Account Receivables | ||||||||||
| Changes in Inventories | ||||||||||
| Changes in Accounts Payable | ||||||||||
| Capital Expenditure | ||||||||||
| UFCF | 166.3 | 895.7 | 494.8 | 1,187.6 | 1,179.6 | 955.8 | 1,149.2 | 1,227.2 | 1,310.5 | 1,399.4 |
| WACC, % | 6.45 | 6.43 | 6.45 | 6.39 | 6.44 | 6.43 | 6.43 | 6.43 | 6.43 | 6.43 |
| PV UFCF | ||||||||||
| SUM PV UFCF | 4,976.4 | |||||||||
| Long Term Growth Rate, % | 2.00 | |||||||||
| Free cash flow (T + 1) | 1,427 | |||||||||
| Terminal Value | 32,213 | |||||||||
| Present Terminal Value | 23,588 | |||||||||
| Enterprise Value | 28,565 | |||||||||
| Net Debt | 277 | |||||||||
| Equity Value | 28,288 | |||||||||
| Diluted Shares Outstanding, MM | 109 | |||||||||
| Equity Value Per Share | 260.50 |
What You Will Receive
- Genuine AF Gruppen ASA Financial Data: Pre-loaded with AF Gruppen's historical and forecasted figures for detailed analysis.
- Completely Customizable Template: Easily adjust key parameters such as revenue growth, WACC, and EBITDA %.
- Instant Calculations: Watch AF Gruppen’s intrinsic value refresh automatically as you make updates.
- Expert Valuation Tool: Tailored for investors, analysts, and consultants aiming for precise DCF outcomes.
- Intuitive Interface: Straightforward layout and clear guidelines for users of all skill levels.
Key Features
- Pre-Loaded Data: AF Gruppen ASA’s historical financial statements and pre-filled forecasts.
- Fully Adjustable Inputs: Modify WACC, tax rates, revenue growth, and EBITDA margins as needed.
- Instant Results: Watch AF Gruppen ASA’s intrinsic value update in real time.
- Clear Visual Outputs: Dashboard charts illustrate valuation results and essential metrics.
- Built for Accuracy: A professional-grade tool tailored for analysts, investors, and finance professionals.
How It Operates
- Download: Get the pre-loaded Excel file containing AF Gruppen ASA’s (0DH7L) financial data.
- Customize: Tailor your forecasts by modifying revenue growth, EBITDA percentage, and WACC.
- Update Automatically: Experience real-time updates for intrinsic value and NPV calculations.
- Test Scenarios: Generate various projections and instantly compare different outcomes.
- Make Decisions: Leverage the valuation results to inform your investment strategy.
Why Choose the AF Gruppen ASA Calculator?
- Designed for Professionals: A sophisticated tool tailored for analysts, CFOs, and consultants.
- Comprehensive Data: AF Gruppen ASA’s historical and projected financials are preloaded for precise analyses.
- Scenario Analysis: Effortlessly simulate various forecasts and assumptions.
- Clear Results: Instantly calculates intrinsic value, NPV, and essential metrics.
- User-Friendly: Step-by-step guidance ensures a smooth experience.
Who Can Benefit from This Product?
- Professional Investors: Develop comprehensive and accurate valuation models for portfolio evaluation.
- Corporate Finance Teams: Examine valuation scenarios to inform internal decision-making.
- Consultants and Advisors: Equip clients with precise valuation insights for AF Gruppen ASA (0DH7L) stock.
- Students and Educators: Utilize real-world data to enhance financial modeling skills and teaching.
- Construction Industry Enthusiasts: Gain insights into the valuation processes of companies like AF Gruppen ASA (0DH7L).
Contents of the Template
- Pre-Filled Data: Features AF Gruppen ASA’s historical financial performance and projections.
- Discounted Cash Flow Model: An editable DCF valuation model with automatic calculations.
- Weighted Average Cost of Capital (WACC): A dedicated worksheet for calculating WACC using custom inputs.
- Key Financial Ratios: Assess AF Gruppen ASA’s profitability, efficiency, and leverage metrics.
- Customizable Inputs: Easily adjust revenue growth, profit margins, and tax rates.
- Clear Dashboard: Visualizations and tables summarizing essential valuation outcomes.
Disclaimer
All information, articles, and product details provided on this website are for general informational and educational purposes only. We do not claim any ownership over, nor do we intend to infringe upon, any trademarks, copyrights, logos, brand names, or other intellectual property mentioned or depicted on this site. Such intellectual property remains the property of its respective owners, and any references here are made solely for identification or informational purposes, without implying any affiliation, endorsement, or partnership.
We make no representations or warranties, express or implied, regarding the accuracy, completeness, or suitability of any content or products presented. Nothing on this website should be construed as legal, tax, investment, financial, medical, or other professional advice. In addition, no part of this site—including articles or product references—constitutes a solicitation, recommendation, endorsement, advertisement, or offer to buy or sell any securities, franchises, or other financial instruments, particularly in jurisdictions where such activity would be unlawful.
All content is of a general nature and may not address the specific circumstances of any individual or entity. It is not a substitute for professional advice or services. Any actions you take based on the information provided here are strictly at your own risk. You accept full responsibility for any decisions or outcomes arising from your use of this website and agree to release us from any liability in connection with your use of, or reliance upon, the content or products found herein.