
|
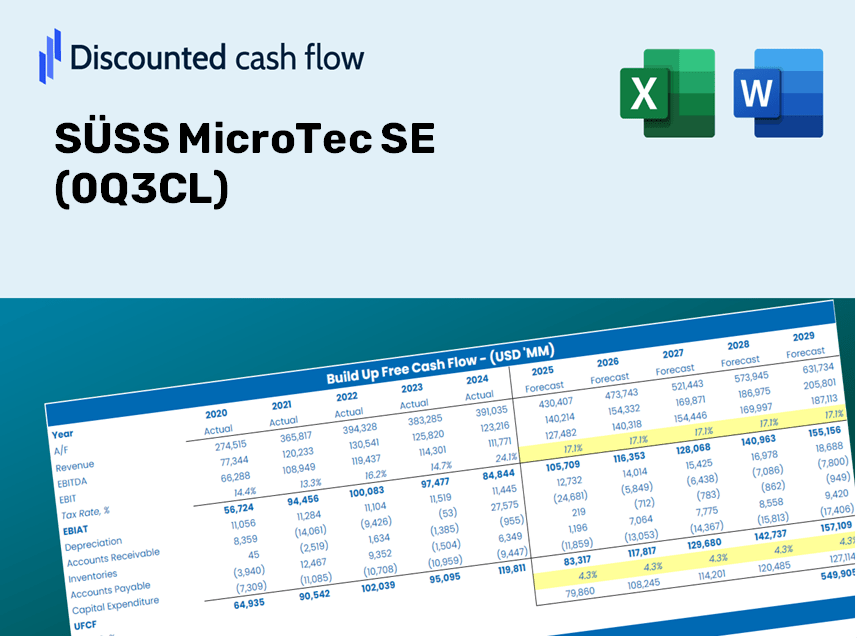
Valoración de DCF de Süss Microtec SE (0q3c.l) |
Completamente Editable: Adáptelo A Sus Necesidades En Excel O Sheets
Diseño Profesional: Plantillas Confiables Y Estándares De La Industria
Predeterminadas Para Un Uso Rápido Y Eficiente
Compatible con MAC / PC, completamente desbloqueado
No Se Necesita Experiencia; Fáciles De Seguir
SÜSS MicroTec SE (0Q3C.L) Bundle
¿Busca determinar el valor intrínseco de Süss Microtec SE? Nuestra calculadora DCF (0Q3CL) ofrece datos del mundo real junto con amplias opciones de personalización, lo que le permite refinar sus pronósticos y mejorar sus decisiones de inversión.
Benefits You Will Receive
- Authentic SÜSS MicroTec Financials: Provides historical and projected data for precise valuation.
- Customizable Inputs: Adjust WACC, tax rates, revenue growth, and capital expenditures to suit your analysis.
- Real-Time Calculations: Intrinsic value and NPV are computed automatically.
- Scenario Analysis: Evaluate various scenarios to assess SÜSS MicroTec’s future performance.
- User-Friendly Interface: Designed for professionals but easy enough for newcomers to navigate.
Key Features
- 🔍 Real-Life SÜSS MicroTec Financials: Pre-filled historical and projected data for SÜSS MicroTec SE (0Q3CL).
- ✏️ Fully Customizable Inputs: Adjust all critical parameters (yellow cells) such as WACC, growth %, and tax rates.
- 📊 Professional DCF Valuation: Built-in formulas calculate SÜSS MicroTec’s intrinsic value using the Discounted Cash Flow method.
- ⚡ Instant Results: Visualize SÜSS MicroTec’s valuation immediately after making adjustments.
- Scenario Analysis: Test and compare outcomes for various financial assumptions side-by-side.
How It Works
- Step 1: Download the Excel file.
- Step 2: Examine SÜSS MicroTec SE's (0Q3CL) pre-filled financial data and forecasts.
- Step 3: Adjust key inputs such as revenue growth, WACC, and tax rates (highlighted cells).
- Step 4: Observe the DCF model refresh in real-time as you modify your assumptions.
- Step 5: Evaluate the outputs and leverage the findings for informed investment decisions.
Why Use This Calculator for SÜSS MicroTec SE (0Q3CL)?
- Designed for Experts: A sophisticated tool trusted by analysts, CFOs, and industry consultants.
- Comprehensive Data: SÜSS MicroTec's historical and projected financials are seamlessly integrated for precision.
- Flexible Scenario Analysis: Effortlessly explore various forecasts and assumptions.
- Transparent Results: Instantly computes intrinsic value, NPV, and essential metrics.
- User-Friendly: Step-by-step guides lead you through each phase of the process.
Who Should Use This Product?
- Individual Investors: Make informed decisions about buying or selling SÜSS MicroTec SE (0Q3CL) stock.
- Financial Analysts: Enhance valuation processes with convenient financial models tailored for SÜSS MicroTec SE (0Q3CL).
- Consultants: Provide clients with precise valuation insights regarding SÜSS MicroTec SE (0Q3CL) swiftly and effectively.
- Business Owners: Gain an understanding of how corporations like SÜSS MicroTec SE (0Q3CL) are valued to inform your business strategy.
- Finance Students: Acquire valuation skills using real-world data and case studies focusing on SÜSS MicroTec SE (0Q3CL).
What the Template Includes
- In-Depth DCF Model: Fully editable template featuring detailed valuation calculations.
- Real-World Data: Historical and projected financials for SÜSS MicroTec SE (0Q3CL) preloaded for your analysis.
- Adjustable Parameters: Modify WACC, growth rates, and tax assumptions to explore various scenarios.
- Comprehensive Financial Statements: Complete annual and quarterly data for enhanced insights.
- Key Financial Ratios: Integrated analysis for assessing profitability, efficiency, and leverage.
- Visual Dashboard: Engaging charts and tables that present clear, actionable results.
Disclaimer
All information, articles, and product details provided on this website are for general informational and educational purposes only. We do not claim any ownership over, nor do we intend to infringe upon, any trademarks, copyrights, logos, brand names, or other intellectual property mentioned or depicted on this site. Such intellectual property remains the property of its respective owners, and any references here are made solely for identification or informational purposes, without implying any affiliation, endorsement, or partnership.
We make no representations or warranties, express or implied, regarding the accuracy, completeness, or suitability of any content or products presented. Nothing on this website should be construed as legal, tax, investment, financial, medical, or other professional advice. In addition, no part of this site—including articles or product references—constitutes a solicitation, recommendation, endorsement, advertisement, or offer to buy or sell any securities, franchises, or other financial instruments, particularly in jurisdictions where such activity would be unlawful.
All content is of a general nature and may not address the specific circumstances of any individual or entity. It is not a substitute for professional advice or services. Any actions you take based on the information provided here are strictly at your own risk. You accept full responsibility for any decisions or outcomes arising from your use of this website and agree to release us from any liability in connection with your use of, or reliance upon, the content or products found herein.