
|
Interroll Holding AG (0qn2.l) Valoración de DCF |
Completamente Editable: Adáptelo A Sus Necesidades En Excel O Sheets
Diseño Profesional: Plantillas Confiables Y Estándares De La Industria
Predeterminadas Para Un Uso Rápido Y Eficiente
Compatible con MAC / PC, completamente desbloqueado
No Se Necesita Experiencia; Fáciles De Seguir
Interroll Holding AG (0QN2.L) Bundle
Diseñada para la precisión, nuestra calculadora DCF (0qn2l) le permite evaluar la valoración de la interreta que retiene AG utilizando datos financieros reales y flexibilidad completa para modificar todos los parámetros clave para las proyecciones mejoradas.
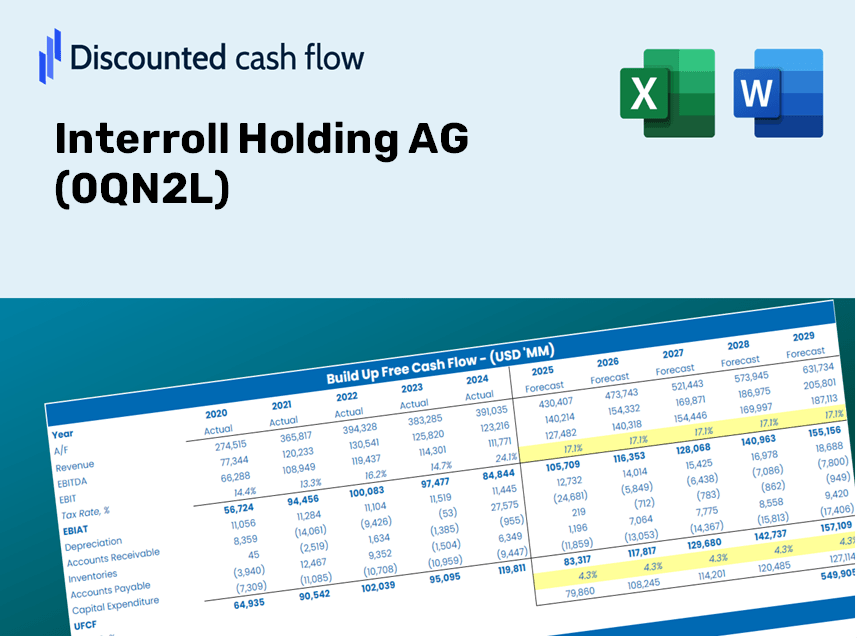
Discounted Cash Flow (DCF) - (USD MM)
| Year | AY1 2020 |
AY2 2021 |
AY3 2022 |
AY4 2023 |
AY5 2024 |
FY1 2025 |
FY2 2026 |
FY3 2027 |
FY4 2028 |
FY5 2029 |
|---|---|---|---|---|---|---|---|---|---|---|
| Revenue | 530.6 | 640.1 | 664.4 | 556.3 | 527.1 | 530.9 | 534.8 | 538.7 | 542.6 | 546.5 |
| Revenue Growth, % | 0 | 20.62 | 3.8 | -16.27 | -5.25 | 0.72672 | 0.72672 | 0.72672 | 0.72672 | 0.72672 |
| EBITDA | 114.3 | 122.7 | 129.3 | 106.6 | 103.8 | 105.2 | 105.9 | 106.7 | 107.5 | 108.2 |
| EBITDA, % | 21.53 | 19.17 | 19.47 | 19.17 | 19.69 | 19.81 | 19.81 | 19.81 | 19.81 | 19.81 |
| Depreciation | 21.3 | 23.1 | 24.1 | 22.4 | 22.6 | 20.8 | 21.0 | 21.1 | 21.3 | 21.4 |
| Depreciation, % | 4.02 | 3.62 | 3.63 | 4.03 | 4.29 | 3.92 | 3.92 | 3.92 | 3.92 | 3.92 |
| EBIT | 92.9 | 99.5 | 105.2 | 84.2 | 81.2 | 84.4 | 85.0 | 85.6 | 86.2 | 86.8 |
| EBIT, % | 17.51 | 15.55 | 15.84 | 15.13 | 15.4 | 15.89 | 15.89 | 15.89 | 15.89 | 15.89 |
| Total Cash | 98.3 | 68.5 | 79.3 | 140.3 | 204.1 | 111.6 | 112.4 | 113.2 | 114.1 | 114.9 |
| Total Cash, percent | .0 | .0 | .0 | .0 | .0 | .0 | .0 | .0 | .0 | .0 |
| Account Receivables | 103.3 | 110.3 | 130.9 | 93.5 | 98.9 | 97.7 | 98.4 | 99.1 | 99.8 | 100.5 |
| Account Receivables, % | 19.47 | 17.24 | 19.7 | 16.8 | 18.76 | 18.39 | 18.39 | 18.39 | 18.39 | 18.39 |
| Inventories | 67.2 | 133.9 | 112.6 | 78.8 | 69.8 | 82.7 | 83.3 | 84.0 | 84.6 | 85.2 |
| Inventories, % | 12.66 | 20.92 | 16.95 | 14.16 | 13.24 | 15.59 | 15.59 | 15.59 | 15.59 | 15.59 |
| Accounts Payable | 18.3 | 38.6 | 22.2 | 14.0 | 18.0 | 19.9 | 20.1 | 20.2 | 20.3 | 20.5 |
| Accounts Payable, % | 3.44 | 6.02 | 3.35 | 2.52 | 3.42 | 3.75 | 3.75 | 3.75 | 3.75 | 3.75 |
| Capital Expenditure | -51.3 | -51.1 | -26.4 | -23.8 | -16.3 | -30.8 | -31.0 | -31.2 | -31.5 | -31.7 |
| Capital Expenditure, % | -9.67 | -7.99 | -3.97 | -4.28 | -3.1 | -5.8 | -5.8 | -5.8 | -5.8 | -5.8 |
| Tax Rate, % | 22.73 | 22.73 | 22.73 | 22.73 | 22.73 | 22.73 | 22.73 | 22.73 | 22.73 | 22.73 |
| EBITAT | 72.0 | 80.8 | 83.1 | 66.6 | 62.7 | 66.5 | 66.9 | 67.4 | 67.9 | 68.4 |
| Depreciation | ||||||||||
| Changes in Account Receivables | ||||||||||
| Changes in Inventories | ||||||||||
| Changes in Accounts Payable | ||||||||||
| Capital Expenditure | ||||||||||
| UFCF | -110.3 | -.6 | 65.3 | 128.3 | 76.6 | 46.6 | 55.7 | 56.1 | 56.5 | 56.9 |
| WACC, % | 8.41 | 8.41 | 8.41 | 8.41 | 8.41 | 8.41 | 8.41 | 8.41 | 8.41 | 8.41 |
| PV UFCF | ||||||||||
| SUM PV UFCF | 213.4 | |||||||||
| Long Term Growth Rate, % | 3.00 | |||||||||
| Free cash flow (T + 1) | 59 | |||||||||
| Terminal Value | 1,085 | |||||||||
| Present Terminal Value | 725 | |||||||||
| Enterprise Value | 938 | |||||||||
| Net Debt | -195 | |||||||||
| Equity Value | 1,133 | |||||||||
| Diluted Shares Outstanding, MM | 1 | |||||||||
| Equity Value Per Share | 1,369.31 |
What You'll Receive
- Authentic Interroll Data: Comprehensive financials – covering everything from revenue to EBIT – based on real and projected figures.
- Complete Customization: Alter all essential parameters (yellow cells) such as WACC, growth rate, and tax rates.
- Immediate Valuation Updates: Automatic recalculations that allow you to assess the effects of changes on Interroll’s fair value.
- Flexible Excel Template: Designed for easy modifications, scenario analysis, and in-depth projections.
- Efficient and Precise: Bypass the hassle of building models from the ground up while ensuring accuracy and adaptability.
Key Features
- Comprehensive DCF Calculator: Features detailed unlevered and levered DCF valuation models tailored for Interroll Holding AG (0QN2L).
- WACC Calculator: Pre-configured Weighted Average Cost of Capital sheet with adjustable inputs for precise calculations.
- Customizable Forecast Assumptions: Flexibly adjust growth rates, capital expenditures, and discount rates to fit your analysis.
- Integrated Financial Ratios: Evaluate profitability, leverage, and efficiency ratios specific to Interroll Holding AG (0QN2L).
- Visual Dashboard and Charts: Graphical representations present key valuation metrics for straightforward insights.
How It Functions
- Download: Obtain the pre-configured Excel file containing Interroll Holding AG's (0QN2L) financial data.
- Customize: Tailor your forecasts, including revenue growth, EBITDA percentage, and WACC.
- Real-Time Updates: The intrinsic value and NPV calculations refresh automatically.
- Scenario Testing: Generate various projections and instantly compare the results.
- Informed Decisions: Leverage the valuation outcomes to inform your investment approach.
Why Select This Calculator for Interroll Holding AG (0QN2L)?
- Designed for Experts: An advanced tool tailored for financial analysts, CFOs, and industry consultants.
- Comprehensive Data: Interroll's historical and projected financial information is preloaded for precise calculations.
- Scenario Analysis: Effortlessly model various forecasts and assumptions.
- Concise Results: Instantly computes intrinsic value, NPV, and essential financial metrics.
- User-Friendly: Step-by-step guidance ensures a smooth navigation experience.
Who Can Benefit from Interroll Holding AG (0QN2L)?
- Investors: Make informed investment choices with a professional-grade valuation tool tailored for Interroll Holding AG (0QN2L).
- Financial Analysts: Save valuable time with a customizable DCF model designed specifically for Interroll Holding AG (0QN2L).
- Consultants: Effortlessly modify the template for client presentations or detailed reports regarding Interroll Holding AG (0QN2L).
- Finance Enthusiasts: Enhance your knowledge of valuation methodologies through practical examples related to Interroll Holding AG (0QN2L).
- Educators and Students: Utilize this resource as a hands-on learning tool in finance courses, focusing on Interroll Holding AG (0QN2L).
Contents of the Template
- Historical Data: Contains Interroll Holding AG’s past financial performance and foundational forecasts.
- DCF and Levered DCF Models: Comprehensive templates to assess the intrinsic value of Interroll Holding AG.
- WACC Sheet: Pre-configured calculations for Weighted Average Cost of Capital.
- Editable Inputs: Adjust key parameters such as growth rates, EBITDA %, and CAPEX projections.
- Quarterly and Annual Statements: An in-depth overview of Interroll Holding AG’s financial statements.
- Interactive Dashboard: Dynamically visualize valuation outcomes and forecasts.
Disclaimer
All information, articles, and product details provided on this website are for general informational and educational purposes only. We do not claim any ownership over, nor do we intend to infringe upon, any trademarks, copyrights, logos, brand names, or other intellectual property mentioned or depicted on this site. Such intellectual property remains the property of its respective owners, and any references here are made solely for identification or informational purposes, without implying any affiliation, endorsement, or partnership.
We make no representations or warranties, express or implied, regarding the accuracy, completeness, or suitability of any content or products presented. Nothing on this website should be construed as legal, tax, investment, financial, medical, or other professional advice. In addition, no part of this site—including articles or product references—constitutes a solicitation, recommendation, endorsement, advertisement, or offer to buy or sell any securities, franchises, or other financial instruments, particularly in jurisdictions where such activity would be unlawful.
All content is of a general nature and may not address the specific circumstances of any individual or entity. It is not a substitute for professional advice or services. Any actions you take based on the information provided here are strictly at your own risk. You accept full responsibility for any decisions or outcomes arising from your use of this website and agree to release us from any liability in connection with your use of, or reliance upon, the content or products found herein.