
|
PSP Swiss Property AG (0qo8.l) Valoración de DCF |
Completamente Editable: Adáptelo A Sus Necesidades En Excel O Sheets
Diseño Profesional: Plantillas Confiables Y Estándares De La Industria
Predeterminadas Para Un Uso Rápido Y Eficiente
Compatible con MAC / PC, completamente desbloqueado
No Se Necesita Experiencia; Fáciles De Seguir
PSP Swiss Property AG (0QO8.L) Bundle
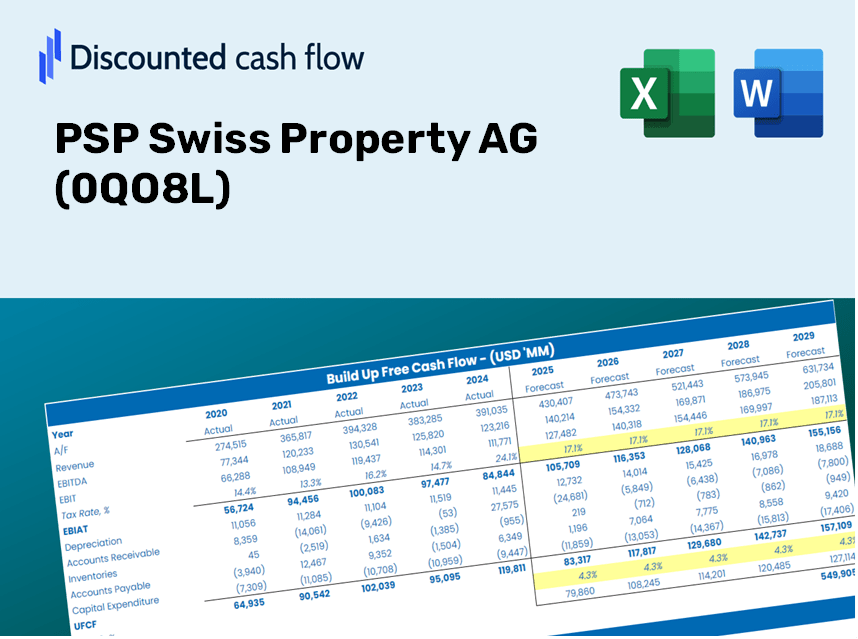
¡Obtenga información sobre su análisis de valoración PSP Swiss Property AG (0QO8L) utilizando nuestra calculadora DCF de última generación! Esta plantilla de Excel viene precargada con datos reales 0QO8L, lo que le permite ajustar los pronósticos y supuestos para determinar con precisión el valor intrínseco de la propiedad suiza PSP AG.
Discounted Cash Flow (DCF) - (USD MM)
| Year | AY1 2020 |
AY2 2021 |
AY3 2022 |
AY4 2023 |
AY5 2024 |
FY1 2025 |
FY2 2026 |
FY3 2027 |
FY4 2028 |
FY5 2029 |
|---|---|---|---|---|---|---|---|---|---|---|
| Revenue | 342.9 | 384.8 | 409.7 | 372.8 | 368.1 | 375.9 | 383.8 | 391.9 | 400.1 | 408.5 |
| Revenue Growth, % | 0 | 12.2 | 6.47 | -9 | -1.25 | 2.1 | 2.1 | 2.1 | 2.1 | 2.1 |
| EBITDA | 271.1 | 287.2 | 292.2 | 298.6 | 489.0 | 304.5 | 310.9 | 317.5 | 324.2 | 331.0 |
| EBITDA, % | 79.04 | 74.63 | 71.32 | 80.09 | 132.82 | 81.02 | 81.02 | 81.02 | 81.02 | 81.02 |
| Depreciation | 76.8 | 141.5 | 178.7 | 1.2 | .9 | 77.7 | 79.3 | 81.0 | 82.7 | 84.5 |
| Depreciation, % | 22.4 | 36.78 | 43.62 | 0.31946 | 0.25507 | 20.67 | 20.67 | 20.67 | 20.67 | 20.67 |
| EBIT | 194.2 | 145.6 | 113.5 | 297.4 | 488.0 | 227.0 | 231.8 | 236.7 | 241.6 | 246.7 |
| EBIT, % | 56.64 | 37.85 | 27.7 | 79.77 | 132.57 | 60.39 | 60.39 | 60.39 | 60.39 | 60.39 |
| Total Cash | 32.3 | 20.4 | 20.7 | 141.7 | 57.0 | 55.1 | 56.2 | 57.4 | 58.6 | 59.9 |
| Total Cash, percent | .0 | .0 | .0 | .0 | .0 | .0 | .0 | .0 | .0 | .0 |
| Account Receivables | 28.3 | 19.1 | 18.7 | 16.1 | 15.3 | 19.7 | 20.1 | 20.6 | 21.0 | 21.4 |
| Account Receivables, % | 8.25 | 4.96 | 4.57 | 4.31 | 4.14 | 5.25 | 5.25 | 5.25 | 5.25 | 5.25 |
| Inventories | 112.7 | 85.0 | 25.4 | 29.8 | 27.5 | 57.6 | 58.8 | 60.1 | 61.3 | 62.6 |
| Inventories, % | 32.86 | 22.09 | 6.21 | 7.99 | 7.47 | 15.32 | 15.32 | 15.32 | 15.32 | 15.32 |
| Accounts Payable | 7.5 | 8.6 | 24.3 | 28.8 | 30.3 | 19.8 | 20.2 | 20.6 | 21.0 | 21.5 |
| Accounts Payable, % | 2.17 | 2.23 | 5.93 | 7.73 | 8.22 | 5.26 | 5.26 | 5.26 | 5.26 | 5.26 |
| Capital Expenditure | -133.8 | -158.2 | -150.0 | -.2 | -91.6 | -106.5 | -108.7 | -111.0 | -113.3 | -115.7 |
| Capital Expenditure, % | -39.01 | -41.1 | -36.61 | -0.0517683 | -24.87 | -28.33 | -28.33 | -28.33 | -28.33 | -28.33 |
| Tax Rate, % | 17.29 | 17.29 | 17.29 | 17.29 | 17.29 | 17.29 | 17.29 | 17.29 | 17.29 | 17.29 |
| EBITAT | 158.4 | 117.2 | 92.6 | 545.1 | 403.6 | 193.6 | 197.6 | 201.8 | 206.1 | 210.4 |
| Depreciation | ||||||||||
| Changes in Account Receivables | ||||||||||
| Changes in Inventories | ||||||||||
| Changes in Accounts Payable | ||||||||||
| Capital Expenditure | ||||||||||
| UFCF | -32.0 | 138.5 | 197.0 | 549.0 | 317.5 | 119.7 | 167.1 | 170.6 | 174.2 | 177.8 |
| WACC, % | 4.61 | 4.59 | 4.61 | 4.84 | 4.62 | 4.65 | 4.65 | 4.65 | 4.65 | 4.65 |
| PV UFCF | ||||||||||
| SUM PV UFCF | 702.6 | |||||||||
| Long Term Growth Rate, % | 2.00 | |||||||||
| Free cash flow (T + 1) | 181 | |||||||||
| Terminal Value | 6,832 | |||||||||
| Present Terminal Value | 5,442 | |||||||||
| Enterprise Value | 6,145 | |||||||||
| Net Debt | 3,328 | |||||||||
| Equity Value | 2,817 | |||||||||
| Diluted Shares Outstanding, MM | 46 | |||||||||
| Equity Value Per Share | 61.42 |
What You Will Receive
- Customizable Excel Template: A fully editable Excel-based DCF Calculator featuring pre-filled financial data for PSP Swiss Property AG (0QO8L).
- Comprehensive Data: Access to historical figures and forward-looking projections (highlighted in the yellow cells).
- Assumption Flexibility: Modify forecast parameters such as revenue growth, EBITDA %, and WACC as needed.
- Real-Time Calculations: Quickly observe how changes in your inputs affect the valuation of PSP Swiss Property AG (0QO8L).
- Professional Resource: Designed specifically for investors, CFOs, consultants, and financial analysts.
- Intuitive Layout: Organized for straightforward navigation, complete with step-by-step guidance.
Key Features
- Comprehensive DCF Calculator: Features thorough unlevered and levered DCF valuation models tailored for PSP Swiss Property AG (0QO8L).
- WACC Calculator: Ready-to-use Weighted Average Cost of Capital template with adjustable parameters.
- Customizable Forecast Assumptions: Easily change growth rates, capital expenditures, and discount rates.
- Integrated Financial Ratios: Assess profitability, leverage, and efficiency ratios specific to PSP Swiss Property AG (0QO8L).
- Interactive Dashboard and Charts: Visual representations facilitate the understanding of key valuation metrics for efficient analysis.
How It Works
- Download the Template: Gain immediate access to the Excel-based PSP Swiss Property AG (0QO8L) DCF Calculator.
- Input Your Assumptions: Modify the yellow-highlighted cells for growth rates, WACC, margins, and more.
- Instant Calculations: The model automatically recalculates the intrinsic value of PSP Swiss Property AG (0QO8L).
- Test Scenarios: Run simulations with various assumptions to assess potential changes in valuation.
- Analyze and Decide: Utilize the results to inform your investment strategy or financial assessment.
Why Opt for This Calculator?
- User-Friendly: Crafted for both novices and experts.
- Customizable Inputs: Effortlessly adjust parameters to suit your analysis needs.
- Real-Time Updates: Instantly view changes to PSP Swiss Property AG’s valuation as you modify inputs.
- Pre-Loaded Data: Comes equipped with PSP Swiss Property AG's actual financial figures for swift assessments.
- Endorsed by Experts: Reliably utilized by investors and analysts for strategic decision-making.
Who Can Benefit from This Product?
- Investors: Assess the valuation of PSP Swiss Property AG (0QO8L) before making stock trades.
- CFOs and Financial Analysts: Enhance valuation workflows and evaluate financial projections.
- Startup Founders: Gain insights into how leading public companies like PSP Swiss Property AG (0QO8L) are assessed.
- Consultants: Create comprehensive valuation reports for your clients.
- Students and Educators: Utilize real market data to learn and teach valuation methodologies.
Overview of Template Features
- Comprehensive DCF Model: A customizable template featuring in-depth valuation calculations.
- Real-World Data: Historical and projected financial data for PSP Swiss Property AG (0QO8L) included for analysis.
- Customizable Parameters: Modify WACC, growth rates, and tax assumptions to explore various scenarios.
- Financial Statements: Complete annual and quarterly breakdowns for enhanced insights.
- Key Ratios: Integrated analysis covering profitability, efficiency, and leverage metrics.
- Dashboard with Visual Outputs: Visual representations including charts and tables for clear, actionable insights.
Disclaimer
All information, articles, and product details provided on this website are for general informational and educational purposes only. We do not claim any ownership over, nor do we intend to infringe upon, any trademarks, copyrights, logos, brand names, or other intellectual property mentioned or depicted on this site. Such intellectual property remains the property of its respective owners, and any references here are made solely for identification or informational purposes, without implying any affiliation, endorsement, or partnership.
We make no representations or warranties, express or implied, regarding the accuracy, completeness, or suitability of any content or products presented. Nothing on this website should be construed as legal, tax, investment, financial, medical, or other professional advice. In addition, no part of this site—including articles or product references—constitutes a solicitation, recommendation, endorsement, advertisement, or offer to buy or sell any securities, franchises, or other financial instruments, particularly in jurisdictions where such activity would be unlawful.
All content is of a general nature and may not address the specific circumstances of any individual or entity. It is not a substitute for professional advice or services. Any actions you take based on the information provided here are strictly at your own risk. You accept full responsibility for any decisions or outcomes arising from your use of this website and agree to release us from any liability in connection with your use of, or reliance upon, the content or products found herein.