
|
Hiag ImmoBilien Holding Ag (0qu6.l) Valoración de DCF |
Completamente Editable: Adáptelo A Sus Necesidades En Excel O Sheets
Diseño Profesional: Plantillas Confiables Y Estándares De La Industria
Predeterminadas Para Un Uso Rápido Y Eficiente
Compatible con MAC / PC, completamente desbloqueado
No Se Necesita Experiencia; Fáciles De Seguir
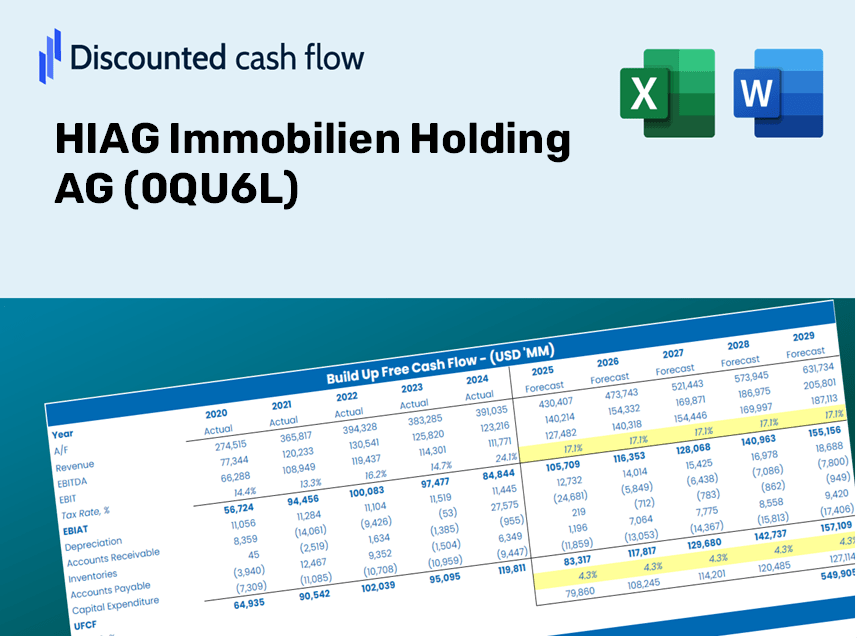
HIAG Immobilien Holding AG (0QU6.L) Bundle
¡Explore el potencial financiero de HIAG Immobilien Holding AG (0qu6l) con nuestra calculadora DCF fácil de usar! Ingrese sus proyecciones para el crecimiento, los márgenes y los gastos para calcular el valor intrínseco de HIAG Immobilien Holding AG (0qu6l) y mejorar su estrategia de inversión.
What You Will Receive
- Adjustable Forecast Variables: Effortlessly modify key assumptions (growth %, margins, WACC) to explore various scenarios.
- Comprehensive Data: HIAG Immobilien Holding AG’s financials pre-loaded to facilitate your analysis.
- Instant DCF Calculations: The template automatically computes Net Present Value (NPV) and intrinsic value for you.
- Professional and Tailored: A refined Excel model that can be customized to meet your valuation requirements.
- Designed for Analysts and Investors: Perfect for assessing projections, validating strategies, and enhancing efficiency.
Key Features
- Customizable Forecast Variables: Adjust essential metrics such as rental income growth, operating margin %, and development costs.
- Instant DCF Valuation: Quickly computes intrinsic value, NPV, and additional financial metrics.
- High-Precision Accuracy: Leverages HIAG Immobilien Holding AG’s (0QU6L) actual financial data for reliable valuation results.
- Simplified Scenario Analysis: Easily evaluate various assumptions and analyze different outcomes.
- Efficiency Booster: Avoid the hassle of constructing intricate valuation models from the ground up.
How It Works
- Step 1: Download the Excel file.
- Step 2: Examine the pre-filled data for HIAG Immobilien Holding AG (0QU6L), including both historical and projected figures.
- Step 3: Modify the key assumptions (indicated in yellow cells) according to your analysis.
- Step 4: Observe the automatic recalculations of HIAG Immobilien Holding AG’s intrinsic value.
- Step 5: Utilize the results for making investment decisions or for reporting purposes.
Why Opt for This Calculator?
- Designed for Experts: A sophisticated tool favored by analysts, CFOs, and financial consultants.
- Accurate Data: HIAG Immobilien Holding AG’s historical and projected financials preloaded for precision.
- Scenario Analysis: Effortlessly simulate various forecasts and assumptions.
- Clear Results: Automatically computes intrinsic value, NPV, and essential metrics.
- User-Friendly: Step-by-step guidance ensures a smooth experience.
Who Can Benefit from HIAG Immobilien Holding AG (0QU6L)?
- Investors: Make informed decisions with a professional-grade valuation tool tailored for real estate.
- Financial Analysts: Streamline your analysis with a pre-built DCF model designed for easy customization.
- Consultants: Effortlessly modify the template for client reports and presentations specific to the property market.
- Real Estate Enthusiasts: Enhance your knowledge of valuation methods through practical, real-world scenarios.
- Educators and Students: Utilize this resource as a hands-on learning aid in real estate and finance courses.
Contents of the Template
- Comprehensive DCF Model: An editable template featuring in-depth valuation calculations.
- Real-World Data: Historical and projected financials of HIAG Immobilien Holding AG (0QU6L) preloaded for your analysis.
- Customizable Parameters: Modify WACC, growth rates, and tax assumptions to explore various scenarios.
- Financial Statements: Complete annual and quarterly breakdowns for a more detailed understanding.
- Key Ratios: Integrated analysis focusing on profitability, efficiency, and leverage metrics.
- Dashboard with Visual Outputs: Charts and tables designed to provide clear, actionable insights.
Disclaimer
All information, articles, and product details provided on this website are for general informational and educational purposes only. We do not claim any ownership over, nor do we intend to infringe upon, any trademarks, copyrights, logos, brand names, or other intellectual property mentioned or depicted on this site. Such intellectual property remains the property of its respective owners, and any references here are made solely for identification or informational purposes, without implying any affiliation, endorsement, or partnership.
We make no representations or warranties, express or implied, regarding the accuracy, completeness, or suitability of any content or products presented. Nothing on this website should be construed as legal, tax, investment, financial, medical, or other professional advice. In addition, no part of this site—including articles or product references—constitutes a solicitation, recommendation, endorsement, advertisement, or offer to buy or sell any securities, franchises, or other financial instruments, particularly in jurisdictions where such activity would be unlawful.
All content is of a general nature and may not address the specific circumstances of any individual or entity. It is not a substitute for professional advice or services. Any actions you take based on the information provided here are strictly at your own risk. You accept full responsibility for any decisions or outcomes arising from your use of this website and agree to release us from any liability in connection with your use of, or reliance upon, the content or products found herein.