
|
Intershop Holding AG (0R6M.L) Valoración de DCF |
Completamente Editable: Adáptelo A Sus Necesidades En Excel O Sheets
Diseño Profesional: Plantillas Confiables Y Estándares De La Industria
Predeterminadas Para Un Uso Rápido Y Eficiente
Compatible con MAC / PC, completamente desbloqueado
No Se Necesita Experiencia; Fáciles De Seguir
Intershop Holding AG (0R6M.L) Bundle
¡Explore las perspectivas financieras de Intershop Holding AG (0R6ML) con nuestra calculadora DCF fácil de usar! Ingrese sus suposiciones con respecto al crecimiento, los márgenes y los costos para calcular el valor intrínseco de InterShop Holding AG (0R6ML) y refinar su estrategia de inversión.
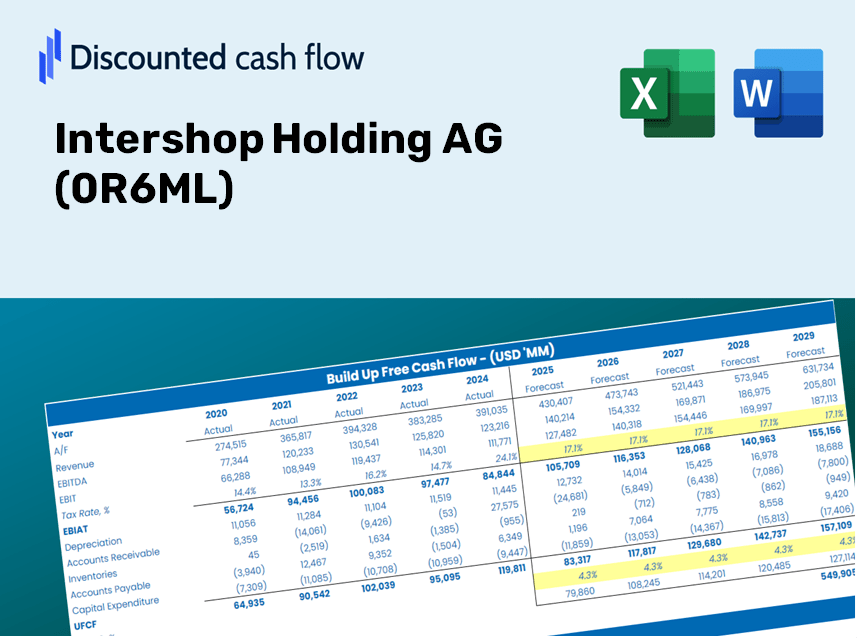
Discounted Cash Flow (DCF) - (USD MM)
| Year | AY1 2020 |
AY2 2021 |
AY3 2022 |
AY4 2023 |
AY5 2024 |
FY1 2025 |
FY2 2026 |
FY3 2027 |
FY4 2028 |
FY5 2029 |
|---|---|---|---|---|---|---|---|---|---|---|
| Revenue | 117.8 | 186.6 | 233.6 | 172.1 | 109.7 | 115.5 | 121.6 | 128.0 | 134.7 | 141.8 |
| Revenue Growth, % | 0 | 58.44 | 25.23 | -26.36 | -36.23 | 5.27 | 5.27 | 5.27 | 5.27 | 5.27 |
| EBITDA | 94.4 | 162.9 | 193.4 | 93.3 | 86.6 | 88.6 | 93.2 | 98.1 | 103.3 | 108.8 |
| EBITDA, % | 80.16 | 87.33 | 82.76 | 54.23 | 78.9 | 76.68 | 76.68 | 76.68 | 76.68 | 76.68 |
| Depreciation | .1 | .1 | .1 | .1 | .1 | .1 | .1 | .1 | .1 | .1 |
| Depreciation, % | 0.12059 | 0.07289216 | 0.05606845 | 0.07381489 | 0.09478846 | 0.08363005 | 0.08363005 | 0.08363005 | 0.08363005 | 0.08363005 |
| EBIT | 94.3 | 162.8 | 193.2 | 93.2 | 86.5 | 88.5 | 93.1 | 98.0 | 103.2 | 108.6 |
| EBIT, % | 80.04 | 87.26 | 82.7 | 54.16 | 78.8 | 76.59 | 76.59 | 76.59 | 76.59 | 76.59 |
| Total Cash | 33.5 | 31.7 | 52.7 | 17.3 | 20.5 | 22.3 | 23.5 | 24.8 | 26.1 | 27.4 |
| Total Cash, percent | .0 | .0 | .0 | .0 | .0 | .0 | .0 | .0 | .0 | .0 |
| Account Receivables | 9.6 | 6.2 | 7.2 | 5.5 | 12.7 | 6.8 | 7.1 | 7.5 | 7.9 | 8.3 |
| Account Receivables, % | 8.16 | 3.32 | 3.09 | 3.22 | 11.57 | 5.87 | 5.87 | 5.87 | 5.87 | 5.87 |
| Inventories | .0 | 45.1 | 50.4 | 3.1 | .0 | 11.0 | 11.6 | 12.2 | 12.8 | 13.5 |
| Inventories, % | 0 | 24.16 | 21.58 | 1.78 | 0 | 9.5 | 9.5 | 9.5 | 9.5 | 9.5 |
| Accounts Payable | .0 | .0 | .0 | .0 | .0 | .0 | .0 | .0 | .0 | .0 |
| Accounts Payable, % | 0 | 0 | 0 | 0 | 0 | 0 | 0 | 0 | 0 | 0 |
| Capital Expenditure | -.1 | -.1 | -.1 | .0 | -.5 | -.1 | -.2 | -.2 | -.2 | -.2 |
| Capital Expenditure, % | -0.07897553 | -0.03966191 | -0.05778046 | -0.01220561 | -0.43475 | -0.12467 | -0.12467 | -0.12467 | -0.12467 | -0.12467 |
| Tax Rate, % | 13.87 | 13.87 | 13.87 | 13.87 | 13.87 | 13.87 | 13.87 | 13.87 | 13.87 | 13.87 |
| EBITAT | 89.9 | 141.5 | 201.2 | 77.5 | 74.5 | 79.9 | 84.1 | 88.5 | 93.2 | 98.1 |
| Depreciation | ||||||||||
| Changes in Account Receivables | ||||||||||
| Changes in Inventories | ||||||||||
| Changes in Accounts Payable | ||||||||||
| Capital Expenditure | ||||||||||
| UFCF | 80.4 | 99.9 | 194.8 | 126.6 | 70.0 | 74.8 | 83.1 | 87.5 | 92.1 | 97.0 |
| WACC, % | 4.84 | 4.76 | 4.88 | 4.72 | 4.75 | 4.79 | 4.79 | 4.79 | 4.79 | 4.79 |
| PV UFCF | ||||||||||
| SUM PV UFCF | 376.3 | |||||||||
| Long Term Growth Rate, % | 2.00 | |||||||||
| Free cash flow (T + 1) | 99 | |||||||||
| Terminal Value | 3,547 | |||||||||
| Present Terminal Value | 2,807 | |||||||||
| Enterprise Value | 3,183 | |||||||||
| Net Debt | 502 | |||||||||
| Equity Value | 2,682 | |||||||||
| Diluted Shares Outstanding, MM | 9 | |||||||||
| Equity Value Per Share | 290.96 |
What You Will Receive
- Genuine Intershop Financials: Access to historical and projected data for precise valuation.
- Customizable Parameters: Adjust WACC, tax rates, revenue growth, and capital expenditures as needed.
- Automated Calculations: Calculate intrinsic value and NPV in real-time.
- Scenario Analysis: Explore various scenarios to assess Intershop's future performance.
- User-Friendly Design: Designed for industry professionals while remaining accessible to newcomers.
Key Features
- Comprehensive DCF Calculator: Offers in-depth unlevered and levered DCF valuation models tailored for Intershop Holding AG (0R6ML).
- WACC Calculator: Features a pre-designed Weighted Average Cost of Capital sheet with adjustable inputs for enhanced analysis.
- Customizable Forecast Assumptions: Easily adjust growth rates, capital expenditures, and discount rates to suit your needs.
- Integrated Financial Ratios: Evaluate profitability, leverage, and efficiency ratios specific to Intershop Holding AG (0R6ML).
- Interactive Dashboard and Charts: Visual representations that summarize essential valuation metrics for streamlined analysis.
How It Works
- Step 1: Download the prebuilt Excel template featuring Intershop Holding AG's data.
- Step 2: Navigate through the pre-filled sheets to familiarize yourself with essential metrics.
- Step 3: Modify forecasts and assumptions in the editable yellow cells (WACC, growth, margins).
- Step 4: Instantly view the updated results, including Intershop Holding AG's intrinsic value.
- Step 5: Utilize the outputs to make informed investment decisions or create detailed reports.
Why Opt for the Intershop Holding AG Calculator?
- Time-Efficient: Skip the hassle of building a DCF model from scratch – it’s immediately available.
- Enhanced Precision: Dependable financial data and formulas minimize valuation errors.
- Completely Customizable: Adjust the model to align with your assumptions and forecasts.
- Easy to Understand: Intuitive charts and outputs simplify result analysis.
- Endorsed by Professionals: Created for experts who prioritize accuracy and ease of use.
Who Can Benefit from Intershop Holding AG (0R6ML)?
- Finance Students: Master valuation techniques and practice with actual market data.
- Researchers: Integrate industry-standard models into your studies or scholarly work.
- Investors: Evaluate your own theories and assess valuation results for Intershop Holding AG (0R6ML).
- Analysts: Enhance your efficiency with a ready-to-use, adaptable DCF model.
- Entrepreneurs: Discover how major public companies like Intershop Holding AG (0R6ML) are evaluated.
Contents of the Template
- Detailed DCF Model: Editable template featuring comprehensive valuation calculations.
- Real-World Data: Intershop Holding AG’s historical and projected financials preloaded for analysis.
- Customizable Variables: Modify WACC, growth rates, and tax assumptions to explore different scenarios.
- Financial Statements: Complete annual and quarterly reports for enhanced insights.
- Key Financial Ratios: Integrated analysis for assessing profitability, efficiency, and leverage.
- Visual Dashboard: Charts and tables designed for clear, actionable insights.
Disclaimer
All information, articles, and product details provided on this website are for general informational and educational purposes only. We do not claim any ownership over, nor do we intend to infringe upon, any trademarks, copyrights, logos, brand names, or other intellectual property mentioned or depicted on this site. Such intellectual property remains the property of its respective owners, and any references here are made solely for identification or informational purposes, without implying any affiliation, endorsement, or partnership.
We make no representations or warranties, express or implied, regarding the accuracy, completeness, or suitability of any content or products presented. Nothing on this website should be construed as legal, tax, investment, financial, medical, or other professional advice. In addition, no part of this site—including articles or product references—constitutes a solicitation, recommendation, endorsement, advertisement, or offer to buy or sell any securities, franchises, or other financial instruments, particularly in jurisdictions where such activity would be unlawful.
All content is of a general nature and may not address the specific circumstances of any individual or entity. It is not a substitute for professional advice or services. Any actions you take based on the information provided here are strictly at your own risk. You accept full responsibility for any decisions or outcomes arising from your use of this website and agree to release us from any liability in connection with your use of, or reliance upon, the content or products found herein.