
|
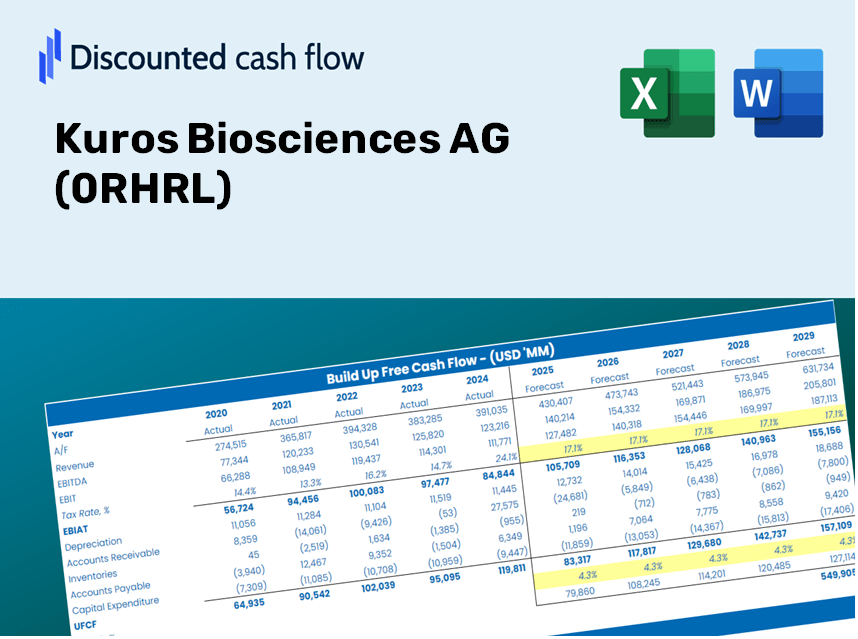
Kuros Biosciences AG (0rhr.l) Valoración de DCF |
Completamente Editable: Adáptelo A Sus Necesidades En Excel O Sheets
Diseño Profesional: Plantillas Confiables Y Estándares De La Industria
Predeterminadas Para Un Uso Rápido Y Eficiente
Compatible con MAC / PC, completamente desbloqueado
No Se Necesita Experiencia; Fáciles De Seguir
Kuros Biosciences AG (0RHR.L) Bundle
Ya sea que sea un inversionista o un analista, esta calculadora DCF (0RHRL) es su herramienta de referencia para una valoración precisa. Equipado con datos reales de Kuros Biosciences AG, puede ajustar los pronósticos y observar los efectos en tiempo real.
Discounted Cash Flow (DCF) - (USD MM)
| Year | AY1 2020 |
AY2 2021 |
AY3 2022 |
AY4 2023 |
AY5 2024 |
FY1 2025 |
FY2 2026 |
FY3 2027 |
FY4 2028 |
FY5 2029 |
|---|---|---|---|---|---|---|---|---|---|---|
| Revenue | 4.0 | 13.8 | 18.0 | 33.6 | 75.6 | 135.4 | 242.6 | 434.8 | 779.2 | 1,396.3 |
| Revenue Growth, % | 0 | 242.04 | 30.19 | 86.61 | 125.11 | 79.2 | 79.2 | 79.2 | 79.2 | 79.2 |
| EBITDA | -8.6 | -5.3 | -8.8 | -6.8 | -.6 | -56.5 | -101.2 | -181.4 | -325.0 | -582.4 |
| EBITDA, % | -212.35 | -38.3 | -49.15 | -20.37 | -0.74251 | -41.71 | -41.71 | -41.71 | -41.71 | -41.71 |
| Depreciation | 2.7 | 2.9 | 2.8 | 2.8 | 2.6 | 31.0 | 55.5 | 99.5 | 178.2 | 319.4 |
| Depreciation, % | 66.08 | 20.85 | 15.76 | 8.2 | 3.49 | 22.87 | 22.87 | 22.87 | 22.87 | 22.87 |
| EBIT | -11.2 | -8.2 | -11.7 | -9.6 | -3.2 | -69.6 | -124.6 | -223.4 | -400.3 | -717.3 |
| EBIT, % | -278.44 | -59.15 | -64.91 | -28.57 | -4.23 | -51.37 | -51.37 | -51.37 | -51.37 | -51.37 |
| Total Cash | 28.4 | 28.6 | 24.1 | 14.2 | 17.5 | 99.0 | 177.3 | 317.8 | 569.5 | 1,020.5 |
| Total Cash, percent | .0 | .0 | .0 | .0 | .0 | .0 | .0 | .0 | .0 | .0 |
| Account Receivables | 1.2 | 1.9 | 3.6 | 7.6 | 14.9 | 28.6 | 51.3 | 91.9 | 164.8 | 295.3 |
| Account Receivables, % | 29.59 | 13.58 | 20.12 | 22.69 | 19.76 | 21.15 | 21.15 | 21.15 | 21.15 | 21.15 |
| Inventories | 1.5 | 1.8 | 3.2 | 4.9 | 9.4 | 25.3 | 45.4 | 81.3 | 145.6 | 261.0 |
| Inventories, % | 36.15 | 12.72 | 17.62 | 14.47 | 12.5 | 18.69 | 18.69 | 18.69 | 18.69 | 18.69 |
| Accounts Payable | .9 | .8 | 1.3 | 1.3 | 6.9 | 13.4 | 24.1 | 43.1 | 77.2 | 138.4 |
| Accounts Payable, % | 23.17 | 6.12 | 7.24 | 3.88 | 9.15 | 9.91 | 9.91 | 9.91 | 9.91 | 9.91 |
| Capital Expenditure | -.2 | -.4 | -.4 | -.3 | -1.1 | -3.5 | -6.2 | -11.1 | -20.0 | -35.8 |
| Capital Expenditure, % | -5.45 | -2.71 | -2.22 | -0.97128 | -1.47 | -2.56 | -2.56 | -2.56 | -2.56 | -2.56 |
| Tax Rate, % | -11.06 | -11.06 | -11.06 | -11.06 | -11.06 | -11.06 | -11.06 | -11.06 | -11.06 | -11.06 |
| EBITAT | -10.7 | -6.4 | -10.7 | -13.5 | -3.6 | -64.7 | -116.0 | -207.9 | -372.6 | -667.7 |
| Depreciation | ||||||||||
| Changes in Account Receivables | ||||||||||
| Changes in Inventories | ||||||||||
| Changes in Accounts Payable | ||||||||||
| Capital Expenditure | ||||||||||
| UFCF | -10.0 | -5.0 | -10.9 | -16.7 | -8.3 | -60.3 | -98.8 | -177.1 | -317.4 | -568.8 |
| WACC, % | 6.92 | 6.92 | 6.92 | 6.92 | 6.92 | 6.92 | 6.92 | 6.92 | 6.92 | 6.92 |
| PV UFCF | ||||||||||
| SUM PV UFCF | -937.8 | |||||||||
| Long Term Growth Rate, % | 2.00 | |||||||||
| Free cash flow (T + 1) | -580 | |||||||||
| Terminal Value | -11,797 | |||||||||
| Present Terminal Value | -8,443 | |||||||||
| Enterprise Value | -9,381 | |||||||||
| Net Debt | -16 | |||||||||
| Equity Value | -9,366 | |||||||||
| Diluted Shares Outstanding, MM | 37 | |||||||||
| Equity Value Per Share | -251.77 |
What You Will Receive
- Flexible Forecast Inputs: Adjust key assumptions (growth %, profit margins, discount rate) effortlessly to explore various scenarios.
- Accurate Market Data: Kuros Biosciences AG’s financial data pre-loaded to facilitate your evaluation.
- Instant DCF Calculations: The template automatically computes Net Present Value (NPV) and intrinsic value for you.
- Customizable and Professional Design: A refined Excel model that caters to your specific valuation requirements.
- Designed for Analysts and Investors: Perfect for assessing projections, confirming strategies, and enhancing efficiency.
Key Features
- Customizable Forecast Inputs: Adjust vital parameters such as revenue growth, EBITDA %, and capital expenditures to fit your analysis.
- Instant DCF Valuation: Quickly calculates intrinsic value, NPV, and other key metrics with a single click.
- High-Precision Metrics: Leverages Kuros Biosciences AG's (0RHRL) actual financial data for accurate valuation results.
- Streamlined Scenario Analysis: Easily evaluate different assumptions and analyze their potential impacts.
- Efficiency Booster: Avoid the hassle of starting complex valuation models from scratch, saving you valuable time.
How It Functions
- Step 1: Download the Excel spreadsheet.
- Step 2: Examine the pre-filled Kuros Biosciences AG (0RHRL) data (both historical and forecasted).
- Step 3: Modify key assumptions (highlighted in yellow) according to your insights.
- Step 4: Observe the automatic recalculations of Kuros Biosciences AG's (0RHRL) intrinsic value.
- Step 5: Utilize the results for making investment decisions or for reporting purposes.
Why Opt for This Calculator?
- Designed for Industry Experts: A sophisticated tool crafted for analysts, CFOs, and consultants.
- Real-Time Data: Kuros Biosciences AG’s (0RHRL) historical and projected financials integrated for precision.
- Scenario Analysis: Effortlessly test various forecasts and assumptions.
- Comprehensive Outputs: Instantly computes intrinsic value, NPV, and essential metrics.
- User-Friendly: Detailed instructions provide a guided experience throughout the process.
Who Should Consider This Product?
- Institutional Investors: Develop comprehensive and trustworthy valuation models for investment analysis.
- Corporate Finance Departments: Evaluate valuation scenarios to inform strategic planning.
- Financial Consultants and Advisors: Equip clients with precise valuation assessments for Kuros Biosciences AG (0RHRL).
- Academics and Learners: Leverage real-time data to enhance learning and practice in financial modeling.
- Biotech Enthusiasts: Gain insights into how biotech firms like Kuros Biosciences AG (0RHRL) are appraised in the market.
Contents of the Template
- Pre-Filled DCF Model: Kuros Biosciences AG’s (0RHRL) financial data incorporated for immediate application.
- WACC Calculator: Comprehensive calculations for the Weighted Average Cost of Capital.
- Financial Ratios: Assess Kuros Biosciences AG’s (0RHRL) profitability, leverage, and operational efficiency.
- Editable Inputs: Modify assumptions such as growth, margins, and CAPEX to suit your analysis.
- Financial Statements: Annual and quarterly reports for in-depth evaluation.
- Interactive Dashboard: Effortlessly visualize essential valuation metrics and outcomes.
Disclaimer
All information, articles, and product details provided on this website are for general informational and educational purposes only. We do not claim any ownership over, nor do we intend to infringe upon, any trademarks, copyrights, logos, brand names, or other intellectual property mentioned or depicted on this site. Such intellectual property remains the property of its respective owners, and any references here are made solely for identification or informational purposes, without implying any affiliation, endorsement, or partnership.
We make no representations or warranties, express or implied, regarding the accuracy, completeness, or suitability of any content or products presented. Nothing on this website should be construed as legal, tax, investment, financial, medical, or other professional advice. In addition, no part of this site—including articles or product references—constitutes a solicitation, recommendation, endorsement, advertisement, or offer to buy or sell any securities, franchises, or other financial instruments, particularly in jurisdictions where such activity would be unlawful.
All content is of a general nature and may not address the specific circumstances of any individual or entity. It is not a substitute for professional advice or services. Any actions you take based on the information provided here are strictly at your own risk. You accept full responsibility for any decisions or outcomes arising from your use of this website and agree to release us from any liability in connection with your use of, or reliance upon, the content or products found herein.