
|
Sensirion Holding Ag (0se5.l) Valoración de DCF |
Completamente Editable: Adáptelo A Sus Necesidades En Excel O Sheets
Diseño Profesional: Plantillas Confiables Y Estándares De La Industria
Predeterminadas Para Un Uso Rápido Y Eficiente
Compatible con MAC / PC, completamente desbloqueado
No Se Necesita Experiencia; Fáciles De Seguir
Sensirion Holding AG (0SE5.L) Bundle
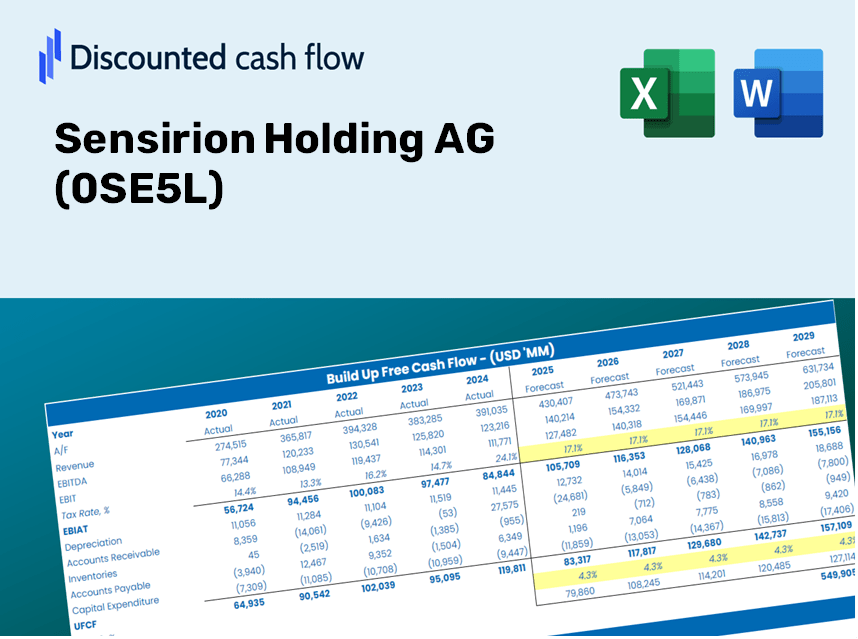
Como inversor o analista, esta calculadora DCF (0SE5L) es su recurso de referencia para una valoración precisa. Cargados con datos reales de Sensirion Holding Ag, puede ajustar los pronósticos y observar instantáneamente los efectos.
Discounted Cash Flow (DCF) - (USD MM)
| Year | AY1 2020 |
AY2 2021 |
AY3 2022 |
AY4 2023 |
AY5 2024 |
FY1 2025 |
FY2 2026 |
FY3 2027 |
FY4 2028 |
FY5 2029 |
|---|---|---|---|---|---|---|---|---|---|---|
| Revenue | 253.7 | 287.5 | 321.7 | 233.2 | 276.5 | 287.8 | 299.5 | 311.7 | 324.4 | 337.6 |
| Revenue Growth, % | 0 | 13.33 | 11.91 | -27.53 | 18.58 | 4.08 | 4.08 | 4.08 | 4.08 | 4.08 |
| EBITDA | 67.9 | 91.1 | 89.6 | 7.3 | 1.8 | 51.8 | 54.0 | 56.2 | 58.5 | 60.8 |
| EBITDA, % | 26.77 | 31.71 | 27.85 | 3.11 | 0.65135 | 18.02 | 18.02 | 18.02 | 18.02 | 18.02 |
| Depreciation | 15.2 | 14.4 | 15.2 | 13.1 | 18.8 | 16.2 | 16.8 | 17.5 | 18.2 | 19.0 |
| Depreciation, % | 5.97 | 5 | 4.72 | 5.61 | 6.79 | 5.62 | 5.62 | 5.62 | 5.62 | 5.62 |
| EBIT | 52.8 | 76.8 | 74.4 | -5.8 | -17.0 | 35.7 | 37.1 | 38.7 | 40.2 | 41.9 |
| EBIT, % | 20.8 | 26.71 | 23.13 | -2.5 | -6.13 | 12.4 | 12.4 | 12.4 | 12.4 | 12.4 |
| Total Cash | 91.9 | 112.1 | 123.0 | 73.1 | 54.4 | 94.7 | 98.5 | 102.5 | 106.7 | 111.1 |
| Total Cash, percent | .0 | .0 | .0 | .0 | .0 | .0 | .0 | .0 | .0 | .0 |
| Account Receivables | 33.9 | 35.1 | 43.2 | 26.2 | 55.6 | 40.5 | 42.1 | 43.8 | 45.6 | 47.5 |
| Account Receivables, % | 13.35 | 12.21 | 13.42 | 11.25 | 20.11 | 14.07 | 14.07 | 14.07 | 14.07 | 14.07 |
| Inventories | 26.5 | 38.3 | 60.1 | 78.0 | 67.4 | 57.7 | 60.0 | 62.5 | 65.0 | 67.7 |
| Inventories, % | 10.43 | 13.32 | 18.67 | 33.43 | 24.38 | 20.05 | 20.05 | 20.05 | 20.05 | 20.05 |
| Accounts Payable | 7.0 | 9.2 | 10.1 | 6.7 | 11.1 | 9.2 | 9.6 | 10.0 | 10.4 | 10.8 |
| Accounts Payable, % | 2.77 | 3.21 | 3.13 | 2.86 | 4.01 | 3.2 | 3.2 | 3.2 | 3.2 | 3.2 |
| Capital Expenditure | -14.2 | -15.4 | -31.2 | -26.9 | -26.0 | -23.9 | -24.9 | -25.9 | -27.0 | -28.1 |
| Capital Expenditure, % | -5.6 | -5.37 | -9.7 | -11.53 | -9.41 | -8.32 | -8.32 | -8.32 | -8.32 | -8.32 |
| Tax Rate, % | -35.44 | -35.44 | -35.44 | -35.44 | -35.44 | -35.44 | -35.44 | -35.44 | -35.44 | -35.44 |
| EBITAT | 48.2 | 66.1 | 66.7 | -3.5 | -23.0 | 30.4 | 31.7 | 33.0 | 34.3 | 35.7 |
| Depreciation | ||||||||||
| Changes in Account Receivables | ||||||||||
| Changes in Inventories | ||||||||||
| Changes in Accounts Payable | ||||||||||
| Capital Expenditure | ||||||||||
| UFCF | -4.2 | 54.1 | 21.6 | -21.6 | -44.6 | 45.6 | 20.0 | 20.8 | 21.6 | 22.5 |
| WACC, % | 8.66 | 8.66 | 8.66 | 8.66 | 8.66 | 8.66 | 8.66 | 8.66 | 8.66 | 8.66 |
| PV UFCF | ||||||||||
| SUM PV UFCF | 105.4 | |||||||||
| Long Term Growth Rate, % | 2.00 | |||||||||
| Free cash flow (T + 1) | 23 | |||||||||
| Terminal Value | 345 | |||||||||
| Present Terminal Value | 228 | |||||||||
| Enterprise Value | 333 | |||||||||
| Net Debt | -54 | |||||||||
| Equity Value | 387 | |||||||||
| Diluted Shares Outstanding, MM | 16 | |||||||||
| Equity Value Per Share | 24.83 |
What You Will Receive
- Genuine Sensirion Data: Preloaded financial information – encompassing everything from revenue to EBIT – based on both actual and projected figures.
- Comprehensive Customization: Modify all essential parameters (yellow cells) such as WACC, growth %, and tax rates to suit your needs.
- Real-Time Valuation Updates: Automatic recalculations that enable you to assess the effects of modifications on the fair value of Sensirion Holding AG (0SE5L).
- Flexible Excel Template: Designed for easy edits, scenario analysis, and in-depth projections.
- Efficient and Precise: Avoid the hassle of constructing models from the ground up while ensuring accuracy and adaptability.
Key Features
- 🔍 Real-Life SENS Financials: Pre-filled historical and projected data for Sensirion Holding AG (0SE5L).
- ✏️ Fully Customizable Inputs: Modify key parameters (yellow cells) such as WACC, growth %, and tax rates.
- 📊 Professional DCF Valuation: Integrated formulas assess Sensirion's intrinsic value using the Discounted Cash Flow method.
- ⚡ Instant Results: See Sensirion's valuation immediately after any adjustments.
- Scenario Analysis: Evaluate and compare results for different financial assumptions side-by-side.
How It Works
- Download: Obtain the pre-configured Excel file containing Sensirion Holding AG's (0SE5L) financial data.
- Customize: Modify forecasts such as revenue growth, EBITDA %, and WACC to suit your analysis.
- Update Automatically: The intrinsic value and NPV calculations refresh in real-time for accuracy.
- Test Scenarios: Generate various projections and instantly compare different outcomes.
- Make Decisions: Leverage the valuation insights to inform your investment approach.
Why Opt for This Calculator?
- All-in-One Solution: Features DCF, WACC, and financial ratio evaluations all in a single platform.
- Adjustable Parameters: Modify the highlighted cells to explore different scenarios.
- In-Depth Analysis: Automatically computes Sensirion’s intrinsic value and Net Present Value.
- Preloaded Information: Historical and projected data provide reliable starting metrics.
- High Standard: Perfect for financial analysts, investors, and business consultants.
Who Can Benefit from This Product?
- Professional Investors: Create comprehensive and reliable valuation models for portfolio assessments.
- Corporate Finance Teams: Evaluate valuation scenarios to inform internal strategic decisions.
- Consultants and Advisors: Offer clients precise valuation insights for Sensirion Holding AG (0SE5L).
- Students and Educators: Utilize real-world data to enhance practical skills in financial modeling.
- Tech Enthusiasts: Discover how technology companies like Sensirion Holding AG (0SE5L) are appraised in the market.
Contents of the Template
- Operating and Balance Sheet Data: Pre-filled historical data and forecasts for Sensirion Holding AG (0SE5L), including revenue, EBITDA, EBIT, and capital expenditures.
- WACC Calculation: A specific sheet dedicated to the Weighted Average Cost of Capital (WACC), featuring parameters such as Beta, risk-free rate, and share price.
- DCF Valuation (Unlevered and Levered): Customizable Discounted Cash Flow models illustrating intrinsic value with comprehensive calculations.
- Financial Statements: Pre-loaded financial statements (annual and quarterly) to facilitate analysis.
- Key Ratios: A collection of profitability, leverage, and efficiency ratios relevant to Sensirion Holding AG (0SE5L).
- Dashboard and Charts: A visual summary of valuation outputs and assumptions for easy analysis of results.
Disclaimer
All information, articles, and product details provided on this website are for general informational and educational purposes only. We do not claim any ownership over, nor do we intend to infringe upon, any trademarks, copyrights, logos, brand names, or other intellectual property mentioned or depicted on this site. Such intellectual property remains the property of its respective owners, and any references here are made solely for identification or informational purposes, without implying any affiliation, endorsement, or partnership.
We make no representations or warranties, express or implied, regarding the accuracy, completeness, or suitability of any content or products presented. Nothing on this website should be construed as legal, tax, investment, financial, medical, or other professional advice. In addition, no part of this site—including articles or product references—constitutes a solicitation, recommendation, endorsement, advertisement, or offer to buy or sell any securities, franchises, or other financial instruments, particularly in jurisdictions where such activity would be unlawful.
All content is of a general nature and may not address the specific circumstances of any individual or entity. It is not a substitute for professional advice or services. Any actions you take based on the information provided here are strictly at your own risk. You accept full responsibility for any decisions or outcomes arising from your use of this website and agree to release us from any liability in connection with your use of, or reliance upon, the content or products found herein.