
|
Beijer Alma AB (0yg7.l) Valoración de DCF |
Completamente Editable: Adáptelo A Sus Necesidades En Excel O Sheets
Diseño Profesional: Plantillas Confiables Y Estándares De La Industria
Predeterminadas Para Un Uso Rápido Y Eficiente
Compatible con MAC / PC, completamente desbloqueado
No Se Necesita Experiencia; Fáciles De Seguir
Beijer Alma AB (publ) (0YG7.L) Bundle
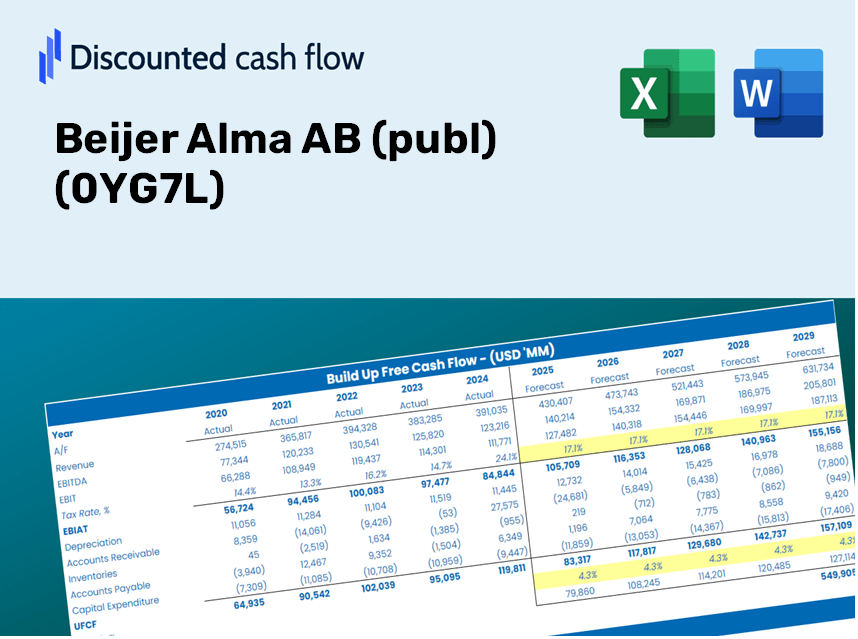
¡Simplifique la valoración de Beijer Alma AB (Publ) con esta calculadora DCF personalizable! Con el verdadero Beijer Alma AB (Publ) Financials y las entradas de pronóstico ajustables, puede probar escenarios y descubrir el valor razonable de Beijer Alma AB (Publ) en minutos.
Discounted Cash Flow (DCF) - (USD MM)
| Year | AY1 2020 |
AY2 2021 |
AY3 2022 |
AY4 2023 |
AY5 2024 |
FY1 2025 |
FY2 2026 |
FY3 2027 |
FY4 2028 |
FY5 2029 |
|---|---|---|---|---|---|---|---|---|---|---|
| Revenue | 4,249.9 | 5,388.5 | 5,865.8 | 6,882.0 | 7,203.0 | 8,240.9 | 9,428.4 | 10,787.0 | 12,341.4 | 14,119.8 |
| Revenue Growth, % | 0 | 26.79 | 8.86 | 17.32 | 4.66 | 14.41 | 14.41 | 14.41 | 14.41 | 14.41 |
| EBITDA | 784.9 | 922.7 | 1,072.1 | 1,187.0 | 1,342.0 | 1,479.2 | 1,692.4 | 1,936.3 | 2,215.3 | 2,534.5 |
| EBITDA, % | 18.47 | 17.12 | 18.28 | 17.25 | 18.63 | 17.95 | 17.95 | 17.95 | 17.95 | 17.95 |
| Depreciation | 239.7 | 210.1 | 274.3 | 250.0 | 255.0 | 352.5 | 403.3 | 461.4 | 527.9 | 604.0 |
| Depreciation, % | 5.64 | 3.9 | 4.68 | 3.63 | 3.54 | 4.28 | 4.28 | 4.28 | 4.28 | 4.28 |
| EBIT | 545.3 | 712.6 | 797.8 | 937.0 | 1,087.0 | 1,126.7 | 1,289.1 | 1,474.8 | 1,687.4 | 1,930.5 |
| EBIT, % | 12.83 | 13.22 | 13.6 | 13.62 | 15.09 | 13.67 | 13.67 | 13.67 | 13.67 | 13.67 |
| Total Cash | 616.1 | 480.5 | 754.3 | 437.0 | 481.0 | 812.6 | 929.7 | 1,063.6 | 1,216.9 | 1,392.3 |
| Total Cash, percent | .0 | .0 | .0 | .0 | .0 | .0 | .0 | .0 | .0 | .0 |
| Account Receivables | 635.1 | 899.4 | 851.0 | 958.0 | 1,220.0 | 1,269.1 | 1,452.0 | 1,661.2 | 1,900.6 | 2,174.5 |
| Account Receivables, % | 14.94 | 16.69 | 14.51 | 13.92 | 16.94 | 15.4 | 15.4 | 15.4 | 15.4 | 15.4 |
| Inventories | 944.9 | 1,360.9 | 1,610.1 | 1,487.0 | 1,720.0 | 1,984.8 | 2,270.8 | 2,598.1 | 2,972.4 | 3,400.8 |
| Inventories, % | 22.23 | 25.26 | 27.45 | 21.61 | 23.88 | 24.09 | 24.09 | 24.09 | 24.09 | 24.09 |
| Accounts Payable | 203.5 | 426.2 | 330.0 | 343.0 | 395.0 | 474.5 | 542.9 | 621.2 | 710.7 | 813.1 |
| Accounts Payable, % | 4.79 | 7.91 | 5.63 | 4.98 | 5.48 | 5.76 | 5.76 | 5.76 | 5.76 | 5.76 |
| Capital Expenditure | -122.2 | -188.9 | -168.4 | -217.0 | -225.0 | -255.9 | -292.8 | -335.0 | -383.3 | -438.5 |
| Capital Expenditure, % | -2.87 | -3.51 | -2.87 | -3.15 | -3.12 | -3.11 | -3.11 | -3.11 | -3.11 | -3.11 |
| Tax Rate, % | 20.22 | 20.22 | 20.22 | 20.22 | 20.22 | 20.22 | 20.22 | 20.22 | 20.22 | 20.22 |
| EBITAT | 419.7 | 544.8 | 611.8 | 677.3 | 867.2 | 861.2 | 985.3 | 1,127.3 | 1,289.7 | 1,475.6 |
| Depreciation | ||||||||||
| Changes in Account Receivables | ||||||||||
| Changes in Inventories | ||||||||||
| Changes in Accounts Payable | ||||||||||
| Capital Expenditure | ||||||||||
| UFCF | -839.3 | 108.5 | 420.7 | 739.4 | 454.2 | 723.4 | 695.3 | 795.5 | 910.1 | 1,041.3 |
| WACC, % | 7.78 | 7.78 | 7.78 | 7.73 | 7.81 | 7.78 | 7.78 | 7.78 | 7.78 | 7.78 |
| PV UFCF | ||||||||||
| SUM PV UFCF | 3,295.7 | |||||||||
| Long Term Growth Rate, % | 2.00 | |||||||||
| Free cash flow (T + 1) | 1,062 | |||||||||
| Terminal Value | 18,384 | |||||||||
| Present Terminal Value | 12,642 | |||||||||
| Enterprise Value | 15,937 | |||||||||
| Net Debt | 2,663 | |||||||||
| Equity Value | 13,274 | |||||||||
| Diluted Shares Outstanding, MM | 60 | |||||||||
| Equity Value Per Share | 220.28 |
What You Will Receive
- Flexible Forecast Inputs: Effortlessly modify assumptions (growth %, margins, WACC) to explore various scenarios.
- Real-World Data: Beijer Alma AB’s financial information pre-filled to facilitate your analysis.
- Automated DCF Outputs: The template calculates Net Present Value (NPV) and intrinsic value automatically for you.
- Custom and Professional: A refined Excel model tailored to meet your valuation requirements.
- Designed for Analysts and Investors: Perfect for evaluating forecasts, confirming strategies, and optimizing your time.
Key Features
- 🔍 Real-Life BEIJER Financials: Pre-filled historical and projected data for Beijer Alma AB (0YG7L).
- ✏️ Fully Customizable Inputs: Adjust all critical parameters (yellow cells) such as WACC, growth %, and tax rates.
- 📊 Professional DCF Valuation: Integrated formulas calculate Beijer Alma’s intrinsic value using the Discounted Cash Flow method.
- ⚡ Instant Results: Visualize Beijer Alma’s valuation immediately after making adjustments.
- Scenario Analysis: Evaluate and compare outcomes for different financial assumptions side-by-side.
How It Works
- Step 1: Download the prebuilt Excel template featuring Beijer Alma AB's (0YG7L) data.
- Step 2: Review the pre-filled sheets to familiarize yourself with the key metrics.
- Step 3: Modify forecasts and assumptions in the editable yellow cells (WACC, growth, margins).
- Step 4: Instantly see recalculated results, including the intrinsic value of Beijer Alma AB (0YG7L).
- Step 5: Use the outputs to make informed investment decisions or generate detailed reports.
Why Use the Beijer Alma AB (0YG7L) Calculator?
- Precision: Based on authentic Beijer Alma financial data for reliable results.
- Versatility: Tailored for users to easily adjust and experiment with inputs.
- Efficiency: Eliminate the complexities of creating a DCF model from the ground up.
- Professional Quality: Crafted with the accuracy and functionality expected by CFOs.
- Intuitive Design: Simple to navigate, even for those without extensive financial modeling knowledge.
Who Should Benefit from This Product?
- Investors: Evaluate Beijer Alma AB (publ) (0YG7L)'s valuation prior to making buying or selling decisions.
- CFOs and Financial Analysts: Optimize valuation workflows and validate financial projections.
- Startup Founders: Gain insights into how leading public companies like Beijer Alma AB (publ) (0YG7L) are appraised.
- Consultants: Provide clients with expert valuation reports based on accurate data.
- Students and Educators: Utilize real market data to learn and teach valuation methodologies.
Contents of the Template
- Historical Data: Includes Beijer Alma AB’s past financials and baseline forecasts.
- DCF and Levered DCF Models: Comprehensive templates to calculate Beijer Alma AB’s intrinsic value.
- WACC Sheet: Pre-built calculations for Weighted Average Cost of Capital.
- Editable Inputs: Adjust key drivers such as growth rates, EBITDA %, and CAPEX assumptions.
- Quarterly and Annual Statements: A complete overview of Beijer Alma AB’s financials.
- Interactive Dashboard: Dynamically visualize valuation results and projections.
Disclaimer
All information, articles, and product details provided on this website are for general informational and educational purposes only. We do not claim any ownership over, nor do we intend to infringe upon, any trademarks, copyrights, logos, brand names, or other intellectual property mentioned or depicted on this site. Such intellectual property remains the property of its respective owners, and any references here are made solely for identification or informational purposes, without implying any affiliation, endorsement, or partnership.
We make no representations or warranties, express or implied, regarding the accuracy, completeness, or suitability of any content or products presented. Nothing on this website should be construed as legal, tax, investment, financial, medical, or other professional advice. In addition, no part of this site—including articles or product references—constitutes a solicitation, recommendation, endorsement, advertisement, or offer to buy or sell any securities, franchises, or other financial instruments, particularly in jurisdictions where such activity would be unlawful.
All content is of a general nature and may not address the specific circumstances of any individual or entity. It is not a substitute for professional advice or services. Any actions you take based on the information provided here are strictly at your own risk. You accept full responsibility for any decisions or outcomes arising from your use of this website and agree to release us from any liability in connection with your use of, or reliance upon, the content or products found herein.