
|
Alibaba Pictures Group Limited (1060.HK) Valoración de DCF |
Completamente Editable: Adáptelo A Sus Necesidades En Excel O Sheets
Diseño Profesional: Plantillas Confiables Y Estándares De La Industria
Predeterminadas Para Un Uso Rápido Y Eficiente
Compatible con MAC / PC, completamente desbloqueado
No Se Necesita Experiencia; Fáciles De Seguir
Alibaba Pictures Group Limited (1060.HK) Bundle
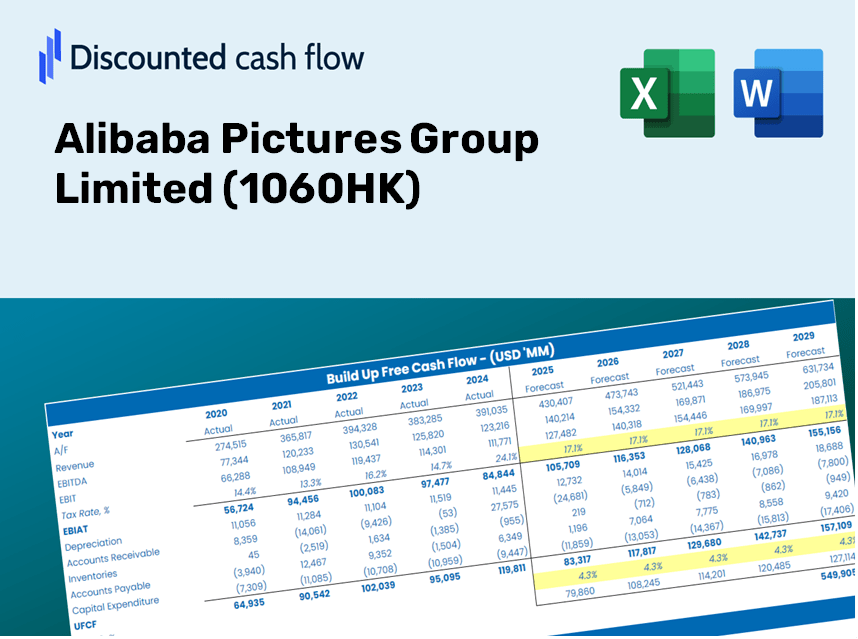
¡Simplifique la valoración de Alibaba Pictures Group Limited (1060HK) con esta calculadora DCF personalizable! Con el Real Alibaba Pictures Group Limited (1060HK) finanzas y entradas de pronóstico ajustables, puede probar escenarios y descubrir el valor razonable de Alibaba Pictures Group Limited (1060HK) en minutos.
Discounted Cash Flow (DCF) - (USD MM)
| Year | AY1 2020 |
AY2 2021 |
AY3 2022 |
AY4 2023 |
AY5 2024 |
FY1 2025 |
FY2 2026 |
FY3 2027 |
FY4 2028 |
FY5 2029 |
|---|---|---|---|---|---|---|---|---|---|---|
| Revenue | 3,119.4 | 3,984.9 | 3,841.1 | 5,494.5 | 7,313.0 | 9,146.3 | 11,439.3 | 14,307.1 | 17,893.9 | 22,379.9 |
| Revenue Growth, % | 0 | 27.75 | -3.61 | 43.05 | 33.1 | 25.07 | 25.07 | 25.07 | 25.07 | 25.07 |
| EBITDA | -19.7 | 261.2 | -14.2 | 387.4 | 444.9 | 341.8 | 427.6 | 534.7 | 668.8 | 836.5 |
| EBITDA, % | -0.63196 | 6.56 | -0.36945 | 7.05 | 6.08 | 3.74 | 3.74 | 3.74 | 3.74 | 3.74 |
| Depreciation | 88.6 | 106.7 | 65.2 | 58.8 | 117.3 | 180.9 | 226.2 | 283.0 | 353.9 | 442.6 |
| Depreciation, % | 2.84 | 2.68 | 1.7 | 1.07 | 1.6 | 1.98 | 1.98 | 1.98 | 1.98 | 1.98 |
| EBIT | -108.3 | 154.5 | -79.4 | 328.6 | 327.6 | 161.0 | 201.3 | 251.8 | 314.9 | 393.9 |
| EBIT, % | -3.47 | 3.88 | -2.07 | 5.98 | 4.48 | 1.76 | 1.76 | 1.76 | 1.76 | 1.76 |
| Total Cash | 4,260.6 | 3,874.8 | 4,276.6 | 8,092.6 | 4,539.6 | 8,402.0 | 10,508.4 | 13,142.9 | 16,437.8 | 20,558.7 |
| Total Cash, percent | .0 | .0 | .0 | .0 | .0 | .0 | .0 | .0 | .0 | .0 |
| Account Receivables | 1,677.9 | 2,568.8 | 2,721.7 | 4,849.7 | 4,717.1 | 6,253.9 | 7,821.7 | 9,782.6 | 12,235.1 | 15,302.4 |
| Account Receivables, % | 53.79 | 64.46 | 70.86 | 88.26 | 64.5 | 68.38 | 68.38 | 68.38 | 68.38 | 68.38 |
| Inventories | -7.6 | 19.5 | 42.3 | 33.9 | 44.8 | 47.1 | 58.9 | 73.7 | 92.1 | 115.2 |
| Inventories, % | -0.24485 | 0.48823 | 1.1 | 0.61759 | 0.61312 | 0.51493 | 0.51493 | 0.51493 | 0.51493 | 0.51493 |
| Accounts Payable | 348.6 | 424.3 | 399.3 | 507.1 | 782.1 | 953.9 | 1,193.0 | 1,492.1 | 1,866.1 | 2,334.0 |
| Accounts Payable, % | 11.18 | 10.65 | 10.4 | 9.23 | 10.7 | 10.43 | 10.43 | 10.43 | 10.43 | 10.43 |
| Capital Expenditure | -24.5 | -18.0 | -10.8 | -13.0 | -192.5 | -80.2 | -100.4 | -125.5 | -157.0 | -196.3 |
| Capital Expenditure, % | -0.78555 | -0.45274 | -0.28003 | -0.23597 | -2.63 | -0.87727 | -0.87727 | -0.87727 | -0.87727 | -0.87727 |
| Tax Rate, % | -23.67 | -23.67 | -23.67 | -23.67 | -23.67 | -23.67 | -23.67 | -23.67 | -23.67 | -23.67 |
| EBITAT | -107.5 | 203.6 | -79.3 | 311.5 | 405.2 | 159.0 | 198.9 | 248.8 | 311.1 | 389.1 |
| Depreciation | ||||||||||
| Changes in Account Receivables | ||||||||||
| Changes in Inventories | ||||||||||
| Changes in Accounts Payable | ||||||||||
| Capital Expenditure | ||||||||||
| UFCF | -1,365.1 | -550.0 | -225.6 | -1,654.4 | 726.7 | -1,107.6 | -1,015.7 | -1,270.4 | -1,588.9 | -1,987.2 |
| WACC, % | 6.81 | 6.81 | 6.81 | 6.81 | 6.81 | 6.81 | 6.81 | 6.81 | 6.81 | 6.81 |
| PV UFCF | ||||||||||
| SUM PV UFCF | -5,620.4 | |||||||||
| Long Term Growth Rate, % | 3.00 | |||||||||
| Free cash flow (T + 1) | -2,047 | |||||||||
| Terminal Value | -53,741 | |||||||||
| Present Terminal Value | -38,661 | |||||||||
| Enterprise Value | -44,281 | |||||||||
| Net Debt | -2,012 | |||||||||
| Equity Value | -42,269 | |||||||||
| Diluted Shares Outstanding, MM | 29,666 | |||||||||
| Equity Value Per Share | -1.42 |
What You Will Receive
- Authentic Alibaba Data: Preloaded financial metrics – from revenue to EBIT – derived from real and forecasted figures.
- Comprehensive Customization: Modify all essential parameters (yellow cells) such as WACC, growth %, and tax rates.
- Instant Valuation Updates: Automated recalculations to evaluate the effects of changes on Alibaba Pictures Group Limited’s fair value.
- Flexible Excel Template: Designed for quick adjustments, scenario analysis, and in-depth projections.
- Time-Efficient and Precise: Avoid starting from scratch while ensuring accuracy and adaptability.
Key Features
- 🔍 Real-Life 1060HK Financials: Pre-filled historical and projected data for Alibaba Pictures Group Limited.
- ✏️ Fully Customizable Inputs: Adjust all key parameters (yellow cells) such as WACC, growth %, and tax rates.
- 📊 Professional DCF Valuation: Integrated formulas calculate Alibaba Pictures’ intrinsic value utilizing the Discounted Cash Flow method.
- ⚡ Instant Results: View Alibaba Pictures’ valuation immediately after adjustments.
- Scenario Analysis: Evaluate and compare outcomes for different financial assumptions side-by-side.
How It Functions
- Download the Template: Gain immediate access to the Excel-based AAPL DCF Calculator.
- Input Your Assumptions: Modify the yellow-highlighted cells for growth rates, WACC, margins, and more.
- Instant Calculations: The model automatically recalculates Alibaba Pictures Group Limited’s intrinsic value.
- Test Scenarios: Experiment with various assumptions to assess possible valuation shifts.
- Analyze and Decide: Utilize the results to inform your investment or financial strategies.
Why Opt for This Calculator?
- Precise Data: Access authentic Alibaba Pictures Group Limited (1060HK) financials for trustworthy valuation outcomes.
- Tailorable: Modify essential parameters such as growth rates, WACC, and tax rates to suit your forecasts.
- Efficient: Pre-configured calculations save you from having to build from the ground up.
- Expert-Level Tool: Crafted for investors, analysts, and consultants looking for depth.
- Easy to Use: A user-friendly interface with clear, step-by-step guidance for all users.
Who Can Benefit from This Product?
- Film Studies Students: Explore valuation methods and apply them using real industry data.
- Researchers: Integrate established financial models into academic projects or studies.
- Investors: Test your own hypotheses and evaluate valuation scenarios for Alibaba Pictures Group Limited (1060HK).
- Financial Analysts: Optimize your analysis process with a ready-to-use, customizable DCF model.
- Independent Filmmakers: Understand the evaluation methods used for major production companies like Alibaba Pictures.
Contents of the Template
- Historical Data: Comprises Alibaba Pictures' previous financial performance and foundational forecasts.
- DCF and Levered DCF Models: Comprehensive templates for determining Alibaba Pictures' intrinsic value.
- WACC Sheet: Ready-to-use calculations for Weighted Average Cost of Capital.
- Editable Inputs: Adjust essential variables such as growth rates, EBITDA %, and CAPEX expectations.
- Quarterly and Annual Statements: An in-depth analysis of Alibaba Pictures' financials.
- Interactive Dashboard: Dynamically visualize valuation results and future projections.
Disclaimer
All information, articles, and product details provided on this website are for general informational and educational purposes only. We do not claim any ownership over, nor do we intend to infringe upon, any trademarks, copyrights, logos, brand names, or other intellectual property mentioned or depicted on this site. Such intellectual property remains the property of its respective owners, and any references here are made solely for identification or informational purposes, without implying any affiliation, endorsement, or partnership.
We make no representations or warranties, express or implied, regarding the accuracy, completeness, or suitability of any content or products presented. Nothing on this website should be construed as legal, tax, investment, financial, medical, or other professional advice. In addition, no part of this site—including articles or product references—constitutes a solicitation, recommendation, endorsement, advertisement, or offer to buy or sell any securities, franchises, or other financial instruments, particularly in jurisdictions where such activity would be unlawful.
All content is of a general nature and may not address the specific circumstances of any individual or entity. It is not a substitute for professional advice or services. Any actions you take based on the information provided here are strictly at your own risk. You accept full responsibility for any decisions or outcomes arising from your use of this website and agree to release us from any liability in connection with your use of, or reliance upon, the content or products found herein.