
|
Salud y felicidad Internacional Holdings Limited (1112.HK) Valoración de DCF |
Completamente Editable: Adáptelo A Sus Necesidades En Excel O Sheets
Diseño Profesional: Plantillas Confiables Y Estándares De La Industria
Predeterminadas Para Un Uso Rápido Y Eficiente
Compatible con MAC / PC, completamente desbloqueado
No Se Necesita Experiencia; Fáciles De Seguir
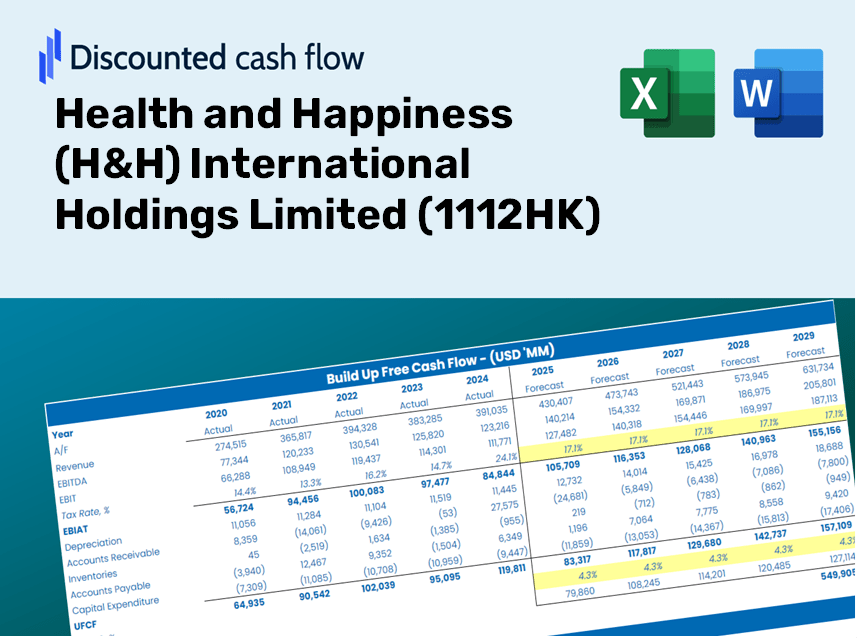
Health and Happiness (H&H) International Holdings Limited (1112.HK) Bundle
¡Explore la perspectiva financiera de la salud y la felicidad (H&H) International Holdings Limited (1112HK) utilizando nuestra calculadora DCF fácil de usar! Ingrese sus proyecciones para el crecimiento, los márgenes y los gastos para determinar el valor intrínseco de (1112HK) y refinar su estrategia de inversión.
Benefits You Will Receive
- Authentic H&H Data: Comprehensive financial insights – from revenue to net income – derived from actual and projected statistics.
- Complete Customization: Modify all essential parameters (highlighted cells) such as discount rates, growth percentages, and tax rates.
- Real-Time Valuation Updates: Automatic recalculations to assess the impact of changes on the fair value of H&H International Holdings (1112HK).
- Dynamic Excel Template: Designed for effortless adjustments, scenario evaluations, and thorough projections.
- Efficient and Precise: Avoid the hassle of creating models from scratch while ensuring accuracy and adaptability.
Key Features
- 🔍 Real-Life H&H Financials: Pre-filled historical and projected data for Health and Happiness (H&H) International Holdings Limited (1112HK).
- ✏️ Fully Customizable Inputs: Modify all essential parameters (highlighted cells) such as WACC, growth %, and tax rates.
- 📊 Professional DCF Valuation: Integrated formulas compute the intrinsic value of H&H using the Discounted Cash Flow method.
- ⚡ Instant Results: View H&H’s valuation immediately after making changes.
- Scenario Analysis: Explore and compare different outcomes based on varying financial assumptions side-by-side.
How It Works
- Download: Get the comprehensive Excel file featuring H&H International Holdings Limited's (1112HK) financial data.
- Customize: Tailor forecasts, including projected revenue growth, EBITDA %, and WACC.
- Update Automatically: Watch as intrinsic value and NPV calculations refresh in real-time.
- Test Scenarios: Generate various projections and instantly compare the results.
- Make Decisions: Leverage the valuation insights to inform your investment strategy.
Why Opt for This Calculator?
- Designed for Experts: A sophisticated tool utilized by financial analysts, CFOs, and industry consultants.
- Accurate Data: H&H International Holdings Limited’s historical and projected financial data is preloaded for precision.
- Forecast Simulation: Easily test various scenarios and assumptions with our intuitive interface.
- Comprehensive Outputs: Automatically computes intrinsic value, NPV, and essential financial metrics.
- User-Friendly: Step-by-step guidance ensures a smooth experience throughout the process.
Who Can Benefit from This Product?
- Investors: Evaluate the valuation of Health and Happiness (H&H) International Holdings Limited (1112HK) before making investment decisions.
- CFOs and Financial Analysts: Enhance efficiency in valuation processes and validate financial projections.
- Startup Founders: Understand the valuation methods employed for significant public companies like Health and Happiness (H&H) International Holdings Limited (1112HK).
- Consultants: Create comprehensive valuation reports to present to clients.
- Students and Educators: Utilize real-time data to practice and teach valuation methodologies.
Contents of the Template
- Pre-Filled Data: Comprehensive historical financials and forecasts for Health and Happiness (H&H) International Holdings Limited (1112HK).
- Discounted Cash Flow Model: An editable DCF valuation model featuring automatic calculations.
- Weighted Average Cost of Capital (WACC): A dedicated worksheet for calculating WACC using your custom inputs.
- Key Financial Ratios: Assess Health and Happiness's profitability, efficiency, and leverage metrics.
- Customizable Inputs: Easily modify revenue growth, margins, and tax rates to fit your analysis.
- Clear Dashboard: Visual representations through charts and tables summarizing critical valuation results.
Disclaimer
All information, articles, and product details provided on this website are for general informational and educational purposes only. We do not claim any ownership over, nor do we intend to infringe upon, any trademarks, copyrights, logos, brand names, or other intellectual property mentioned or depicted on this site. Such intellectual property remains the property of its respective owners, and any references here are made solely for identification or informational purposes, without implying any affiliation, endorsement, or partnership.
We make no representations or warranties, express or implied, regarding the accuracy, completeness, or suitability of any content or products presented. Nothing on this website should be construed as legal, tax, investment, financial, medical, or other professional advice. In addition, no part of this site—including articles or product references—constitutes a solicitation, recommendation, endorsement, advertisement, or offer to buy or sell any securities, franchises, or other financial instruments, particularly in jurisdictions where such activity would be unlawful.
All content is of a general nature and may not address the specific circumstances of any individual or entity. It is not a substitute for professional advice or services. Any actions you take based on the information provided here are strictly at your own risk. You accept full responsibility for any decisions or outcomes arising from your use of this website and agree to release us from any liability in connection with your use of, or reliance upon, the content or products found herein.