
|
CK Asset Holdings Limited (1113.HK) Valoración de DCF |
Completamente Editable: Adáptelo A Sus Necesidades En Excel O Sheets
Diseño Profesional: Plantillas Confiables Y Estándares De La Industria
Predeterminadas Para Un Uso Rápido Y Eficiente
Compatible con MAC / PC, completamente desbloqueado
No Se Necesita Experiencia; Fáciles De Seguir
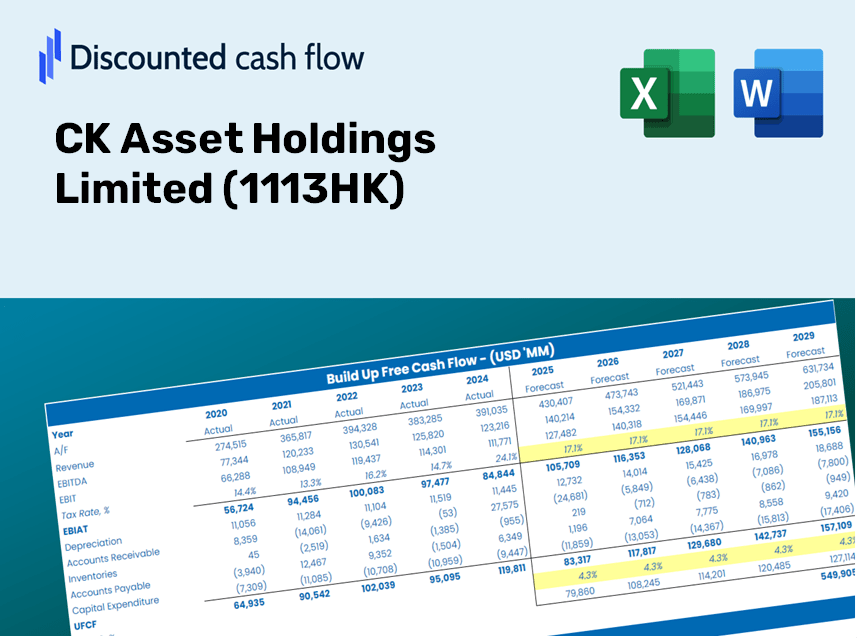
CK Asset Holdings Limited (1113.HK) Bundle
¿Busca evaluar el valor intrínseco de CK Asset Holdings Limited? Nuestra calculadora DCF (1113HK) integra datos del mundo real con extensas funciones de personalización, lo que le permite refinar sus pronósticos y mejorar sus estrategias de inversión.
Discounted Cash Flow (DCF) - (USD MM)
| Year | AY1 2020 |
AY2 2021 |
AY3 2022 |
AY4 2023 |
AY5 2024 |
FY1 2025 |
FY2 2026 |
FY3 2027 |
FY4 2028 |
FY5 2029 |
|---|---|---|---|---|---|---|---|---|---|---|
| Revenue | 57,623.0 | 62,094.0 | 56,341.0 | 47,243.0 | 45,529.0 | 43,106.6 | 40,813.1 | 38,641.7 | 36,585.7 | 34,639.2 |
| Revenue Growth, % | 0 | 7.76 | -9.26 | -16.15 | -3.63 | -5.32 | -5.32 | -5.32 | -5.32 | -5.32 |
| EBITDA | 27,247.0 | 28,731.0 | 19,904.0 | 23,836.0 | 12,006.0 | 17,734.7 | 16,791.1 | 15,897.7 | 15,051.9 | 14,251.0 |
| EBITDA, % | 47.28 | 46.27 | 35.33 | 50.45 | 26.37 | 41.14 | 41.14 | 41.14 | 41.14 | 41.14 |
| Depreciation | 2,246.0 | 2,186.0 | 2,045.0 | 1,927.0 | 1,927.0 | 1,669.0 | 1,580.2 | 1,496.1 | 1,416.5 | 1,341.2 |
| Depreciation, % | 3.9 | 3.52 | 3.63 | 4.08 | 4.23 | 3.87 | 3.87 | 3.87 | 3.87 | 3.87 |
| EBIT | 25,001.0 | 26,545.0 | 17,859.0 | 21,909.0 | 10,079.0 | 16,065.6 | 15,210.9 | 14,401.6 | 13,635.3 | 12,909.9 |
| EBIT, % | 43.39 | 42.75 | 31.7 | 46.38 | 22.14 | 37.27 | 37.27 | 37.27 | 37.27 | 37.27 |
| Total Cash | 59,519.0 | 63,365.0 | 61,198.0 | 42,481.0 | 36,069.0 | 40,446.3 | 38,294.3 | 36,256.9 | 34,327.8 | 32,501.4 |
| Total Cash, percent | .0 | .0 | .0 | .0 | .0 | .0 | .0 | .0 | .0 | .0 |
| Account Receivables | 3,797.0 | 4,991.0 | 3,684.0 | 2,393.0 | 4,285.0 | 3,072.9 | 2,909.4 | 2,754.6 | 2,608.0 | 2,469.3 |
| Account Receivables, % | 6.59 | 8.04 | 6.54 | 5.07 | 9.41 | 7.13 | 7.13 | 7.13 | 7.13 | 7.13 |
| Inventories | 121,737.0 | 127,482.0 | 136,446.0 | 130,101.0 | 129,776.0 | 43,106.6 | 40,813.1 | 38,641.7 | 36,585.7 | 34,639.2 |
| Inventories, % | 211.26 | 205.3 | 242.18 | 275.39 | 285.04 | 100 | 100 | 100 | 100 | 100 |
| Accounts Payable | 4,571.0 | 5,201.0 | 14,207.0 | 4,176.0 | 3,715.0 | 5,045.5 | 4,777.1 | 4,522.9 | 4,282.3 | 4,054.4 |
| Accounts Payable, % | 7.93 | 8.38 | 25.22 | 8.84 | 8.16 | 11.7 | 11.7 | 11.7 | 11.7 | 11.7 |
| Capital Expenditure | -1,324.0 | -3,188.0 | -2,460.0 | -2,403.0 | -2,276.0 | -1,886.7 | -1,786.3 | -1,691.2 | -1,601.3 | -1,516.1 |
| Capital Expenditure, % | -2.3 | -5.13 | -4.37 | -5.09 | -5 | -4.38 | -4.38 | -4.38 | -4.38 | -4.38 |
| Tax Rate, % | 6.01 | 6.01 | 6.01 | 6.01 | 6.01 | 6.01 | 6.01 | 6.01 | 6.01 | 6.01 |
| EBITAT | 17,110.5 | 18,968.5 | 17,294.5 | 18,998.7 | 9,472.9 | 13,412.9 | 12,699.2 | 12,023.6 | 11,383.9 | 10,778.2 |
| Depreciation | ||||||||||
| Changes in Account Receivables | ||||||||||
| Changes in Inventories | ||||||||||
| Changes in Accounts Payable | ||||||||||
| Capital Expenditure | ||||||||||
| UFCF | -102,930.5 | 11,657.5 | 18,228.5 | 16,127.7 | 7,095.9 | 102,407.3 | 14,681.7 | 13,900.6 | 13,161.0 | 12,460.8 |
| WACC, % | 4.81 | 4.85 | 5.12 | 5.01 | 5.09 | 4.98 | 4.98 | 4.98 | 4.98 | 4.98 |
| PV UFCF | ||||||||||
| SUM PV UFCF | 143,503.6 | |||||||||
| Long Term Growth Rate, % | 2.00 | |||||||||
| Free cash flow (T + 1) | 12,710 | |||||||||
| Terminal Value | 427,060 | |||||||||
| Present Terminal Value | 334,993 | |||||||||
| Enterprise Value | 478,496 | |||||||||
| Net Debt | 21,563 | |||||||||
| Equity Value | 456,933 | |||||||||
| Diluted Shares Outstanding, MM | 3,514 | |||||||||
| Equity Value Per Share | 130.02 |
What You Will Receive
- Genuine CK Asset Data: Preloaded financial metrics – from revenue to EBIT – based on both actual and anticipated figures.
- Comprehensive Customization: Modify all key parameters (yellow cells) such as WACC, growth %, and tax rates.
- Real-Time Valuation Adjustments: Automatic recalculations to assess the effect of changes on CK Asset Holdings’ fair value.
- Flexible Excel Template: Designed for quick modifications, scenario analysis, and in-depth projections.
- Efficient and Precise: Eliminate the need to build models from the ground up while ensuring accuracy and adaptability.
Key Features
- Pre-Loaded Data: CK Asset Holdings Limited's historical financial statements and pre-filled forecasts.
- Fully Adjustable Inputs: Customize WACC, tax rates, revenue growth, and EBITDA margins.
- Instant Results: View CK Asset Holdings Limited's intrinsic value recalculating in real time.
- Clear Visual Outputs: Dashboard charts present valuation results and key metrics.
- Built for Accuracy: A professional tool designed for analysts, investors, and finance experts.
How It Operates
- Step 1: Download the Excel file.
- Step 2: Examine the pre-filled data for CK Asset Holdings Limited (1113HK) including historical and forecasted figures.
- Step 3: Modify key assumptions (highlighted in yellow) according to your findings.
- Step 4: Observe the automatic recalculations of CK Asset Holdings Limited’s (1113HK) intrinsic value.
- Step 5: Utilize the generated outputs for your investment strategies or reporting needs.
Why Choose This Calculator for CK Asset Holdings Limited (1113HK)?
- Accuracy: Leverages real financial data for precise results.
- Flexibility: Users can easily adjust and experiment with inputs.
- Time-Saving: Avoid the complexities of constructing a DCF model from the ground up.
- Professional-Grade: Crafted with the expertise expected at the CFO level, ensuring top-notch usability.
- User-Friendly: Intuitive interface suitable for users without extensive financial modeling skills.
Who Can Benefit from This Product?
- Professional Investors: Develop comprehensive and reliable valuation models for analyzing portfolios, particularly for CK Asset Holdings Limited (1113HK).
- Corporate Finance Teams: Evaluate valuation scenarios to inform strategic decisions within the organization.
- Consultants and Advisors: Offer clients accurate valuation assessments for CK Asset Holdings Limited (1113HK).
- Students and Educators: Leverage real-world data to enhance financial modeling skills and teaching methodologies.
- Real Estate Enthusiasts: Gain insights into how companies like CK Asset Holdings Limited (1113HK) are valued in the real estate market.
Contents of the Template
- Operating and Balance Sheet Data: Pre-filled historical data and forecasts for CK Asset Holdings Limited (1113HK), including revenue, EBITDA, EBIT, and capital expenditures.
- WACC Calculation: A dedicated section for calculating the Weighted Average Cost of Capital (WACC), featuring parameters such as Beta, risk-free rate, and share price.
- DCF Valuation (Unlevered and Levered): Customizable Discounted Cash Flow models that illustrate intrinsic value with comprehensive calculations.
- Financial Statements: Pre-loaded annual and quarterly financial statements to enhance analysis.
- Key Ratios: An overview of profitability, leverage, and efficiency ratios specific to CK Asset Holdings Limited (1113HK).
- Dashboard and Charts: A visual summary of valuation results and underlying assumptions for straightforward analysis.
Disclaimer
All information, articles, and product details provided on this website are for general informational and educational purposes only. We do not claim any ownership over, nor do we intend to infringe upon, any trademarks, copyrights, logos, brand names, or other intellectual property mentioned or depicted on this site. Such intellectual property remains the property of its respective owners, and any references here are made solely for identification or informational purposes, without implying any affiliation, endorsement, or partnership.
We make no representations or warranties, express or implied, regarding the accuracy, completeness, or suitability of any content or products presented. Nothing on this website should be construed as legal, tax, investment, financial, medical, or other professional advice. In addition, no part of this site—including articles or product references—constitutes a solicitation, recommendation, endorsement, advertisement, or offer to buy or sell any securities, franchises, or other financial instruments, particularly in jurisdictions where such activity would be unlawful.
All content is of a general nature and may not address the specific circumstances of any individual or entity. It is not a substitute for professional advice or services. Any actions you take based on the information provided here are strictly at your own risk. You accept full responsibility for any decisions or outcomes arising from your use of this website and agree to release us from any liability in connection with your use of, or reliance upon, the content or products found herein.