
|
Valoración de DCF de Realord Group Holdings Limited (1196.HK) |
Completamente Editable: Adáptelo A Sus Necesidades En Excel O Sheets
Diseño Profesional: Plantillas Confiables Y Estándares De La Industria
Predeterminadas Para Un Uso Rápido Y Eficiente
Compatible con MAC / PC, completamente desbloqueado
No Se Necesita Experiencia; Fáciles De Seguir
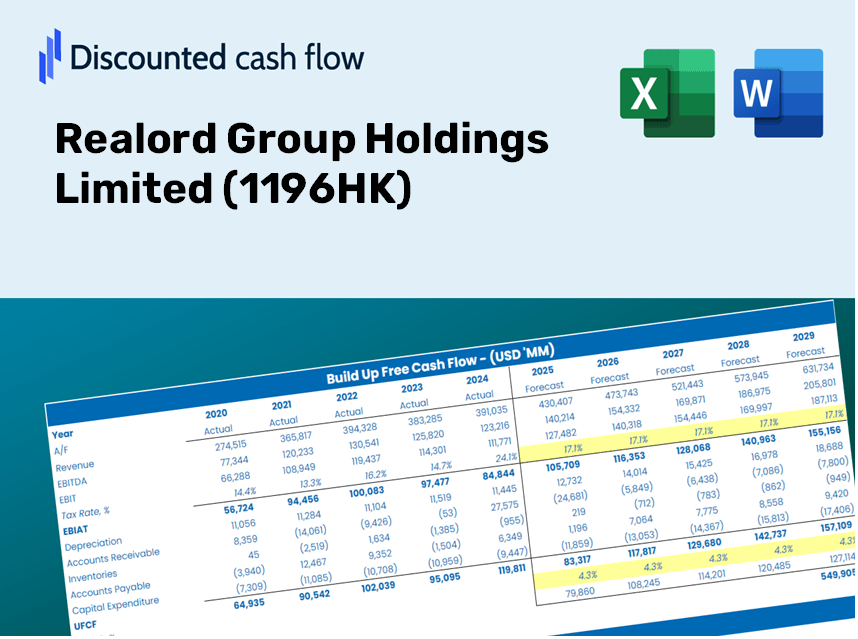
Realord Group Holdings Limited (1196.HK) Bundle
¡Evalúe las perspectivas financieras de Realord Group Holdings Limited (1196HK) como un experto! Esta calculadora DCF (1196HK) proporciona datos financieros previamente llenos junto con una flexibilidad total para modificar el crecimiento de los ingresos, WACC, los márgenes y otros supuestos esenciales para alinearse con sus pronósticos.
Discounted Cash Flow (DCF) - (USD MM)
| Year | AY1 2020 |
AY2 2021 |
AY3 2022 |
AY4 2023 |
AY5 2024 |
FY1 2025 |
FY2 2026 |
FY3 2027 |
FY4 2028 |
FY5 2029 |
|---|---|---|---|---|---|---|---|---|---|---|
| Revenue | 869.3 | 1,195.1 | 1,198.8 | 601.2 | 428.4 | 384.6 | 345.4 | 310.1 | 278.5 | 250.1 |
| Revenue Growth, % | 0 | 37.47 | 0.3122 | -49.85 | -28.75 | -10.2 | -10.2 | -10.2 | -10.2 | -10.2 |
| EBITDA | 2,143.5 | 1,219.5 | 1,220.7 | 1,200.4 | -141.2 | 282.4 | 253.5 | 227.7 | 204.4 | 183.6 |
| EBITDA, % | 246.57 | 102.04 | 101.83 | 199.66 | -32.95 | 73.41 | 73.41 | 73.41 | 73.41 | 73.41 |
| Depreciation | 61.5 | 95.1 | 124.2 | 113.5 | 46.8 | 42.5 | 38.1 | 34.2 | 30.7 | 27.6 |
| Depreciation, % | 7.07 | 7.96 | 10.36 | 18.88 | 10.93 | 11.04 | 11.04 | 11.04 | 11.04 | 11.04 |
| EBIT | 2,082.1 | 1,124.4 | 1,096.5 | 1,086.9 | -188.0 | 262.8 | 236.0 | 211.9 | 190.3 | 170.9 |
| EBIT, % | 239.5 | 94.09 | 91.47 | 180.78 | -43.88 | 68.33 | 68.33 | 68.33 | 68.33 | 68.33 |
| Total Cash | 1,283.6 | 310.9 | 243.1 | 221.8 | 99.1 | 158.7 | 142.5 | 128.0 | 114.9 | 103.2 |
| Total Cash, percent | .0 | .0 | .0 | .0 | .0 | .0 | .0 | .0 | .0 | .0 |
| Account Receivables | 774.0 | 843.5 | 1,505.6 | 853.9 | 1,101.2 | 353.6 | 317.5 | 285.1 | 256.0 | 229.9 |
| Account Receivables, % | 89.03 | 70.58 | 125.59 | 142.03 | 257.07 | 91.92 | 91.92 | 91.92 | 91.92 | 91.92 |
| Inventories | 36.5 | 3,327.9 | 7,599.4 | 57.4 | 5,658.6 | 241.4 | 216.7 | 194.6 | 174.8 | 156.9 |
| Inventories, % | 4.2 | 278.47 | 633.92 | 9.55 | 1321 | 62.75 | 62.75 | 62.75 | 62.75 | 62.75 |
| Accounts Payable | 34.8 | 54.9 | 97.1 | 85.0 | 174.9 | 55.1 | 49.5 | 44.5 | 39.9 | 35.8 |
| Accounts Payable, % | 4.01 | 4.6 | 8.1 | 14.13 | 40.84 | 14.33 | 14.33 | 14.33 | 14.33 | 14.33 |
| Capital Expenditure | -23.0 | -11.4 | -15.4 | -3.0 | -2.6 | -4.6 | -4.1 | -3.7 | -3.3 | -3.0 |
| Capital Expenditure, % | -2.64 | -0.95433 | -1.29 | -0.49366 | -0.60301 | -1.2 | -1.2 | -1.2 | -1.2 | -1.2 |
| Tax Rate, % | 7.44 | 7.44 | 7.44 | 7.44 | 7.44 | 7.44 | 7.44 | 7.44 | 7.44 | 7.44 |
| EBITAT | 1,271.1 | 320.7 | 335.6 | 189.1 | -174.0 | 121.0 | 108.6 | 97.5 | 87.6 | 78.7 |
| Depreciation | ||||||||||
| Changes in Account Receivables | ||||||||||
| Changes in Inventories | ||||||||||
| Changes in Accounts Payable | ||||||||||
| Capital Expenditure | ||||||||||
| UFCF | 533.9 | -2,936.5 | -4,447.2 | 8,481.2 | -5,888.2 | 6,203.8 | 197.7 | 177.5 | 159.4 | 143.2 |
| WACC, % | 4.16 | 3.4 | 3.45 | 3.14 | 4.89 | 3.81 | 3.81 | 3.81 | 3.81 | 3.81 |
| PV UFCF | ||||||||||
| SUM PV UFCF | 6,574.6 | |||||||||
| Long Term Growth Rate, % | 2.00 | |||||||||
| Free cash flow (T + 1) | 146 | |||||||||
| Terminal Value | 8,084 | |||||||||
| Present Terminal Value | 6,707 | |||||||||
| Enterprise Value | 13,281 | |||||||||
| Net Debt | 12,367 | |||||||||
| Equity Value | 915 | |||||||||
| Diluted Shares Outstanding, MM | 1,441 | |||||||||
| Equity Value Per Share | 0.63 |
What You'll Receive
- Customizable Excel Template: A tailored Excel-based DCF Calculator featuring pre-loaded financials for Realord Group Holdings Limited (1196HK).
- Actual Market Data: Access to historical figures and future projections (highlighted in the yellow cells).
- Flexible Forecasting: Adjust forecast parameters such as revenue growth, EBITDA percentages, and WACC.
- Instant Calculations: View the effects of your assumptions on the valuation of Realord Group Holdings Limited (1196HK) immediately.
- Professional Resource: Designed for investors, CFOs, consultants, and financial analysts.
- Intuitive Interface: Organized for simplicity and ease of navigation, complete with step-by-step guidance.
Key Features
- Pre-Loaded Data: Realord Group Holdings Limited’s historical financial statements and pre-filled forecasts.
- Fully Adjustable Inputs: Customize WACC, tax rates, revenue growth, and EBITDA margins.
- Instant Results: Witness Realord Group Holdings Limited’s intrinsic value update in real time.
- Clear Visual Outputs: Dashboard charts showcase valuation results and essential metrics.
- Built for Accuracy: A professional tool designed for analysts, investors, and finance professionals.
How It Operates
- 1. Access the Template: Download and open the Excel file featuring Realord Group Holdings Limited’s preloaded data.
- 2. Modify Assumptions: Adjust key inputs such as growth rates, WACC, and capital expenditures.
- 3. View Results in Real-Time: The DCF model automatically calculates intrinsic value and NPV.
- 4. Experiment with Scenarios: Analyze various forecasts to evaluate different valuation results.
- 5. Present with Assurance: Deliver professional valuation insights to guide your decision-making process.
Why Opt for This Calculator?
- Accuracy: Leverages authentic Realord Group financials for precise data.
- Flexibility: Built to empower users to easily test and adjust inputs.
- Time-Saving: Avoid the complexities of constructing a DCF model from the ground up.
- Professional-Grade: Crafted with CFO-level expertise and user experience in mind.
- User-Friendly: Intuitive design ensures accessibility, even for those without extensive financial modeling knowledge.
Who Can Benefit from Realord Group Holdings Limited (1196HK)?
- Investors: Gain confidence in your investment choices with a top-tier valuation tool.
- Financial Analysts: Streamline your workflow with a customizable DCF model at your fingertips.
- Consultants: Effortlessly modify templates for impactful client presentations and reports.
- Finance Enthusiasts: Enhance your grasp of valuation methods through practical, real-world scenarios.
- Educators and Students: Leverage this resource as an effective learning aid in finance-related studies.
What the Template Contains
- Pre-Filled Data: Includes Realord Group Holdings Limited's historical financials and forecasts.
- Discounted Cash Flow Model: Editable DCF valuation model with automatic calculations.
- Weighted Average Cost of Capital (WACC): A dedicated sheet for calculating WACC based on custom inputs.
- Key Financial Ratios: Analyze Realord Group Holdings Limited's profitability, efficiency, and leverage.
- Customizable Inputs: Modify revenue growth, margins, and tax rates with ease.
- Clear Dashboard: Charts and tables that summarize key valuation results.
Disclaimer
All information, articles, and product details provided on this website are for general informational and educational purposes only. We do not claim any ownership over, nor do we intend to infringe upon, any trademarks, copyrights, logos, brand names, or other intellectual property mentioned or depicted on this site. Such intellectual property remains the property of its respective owners, and any references here are made solely for identification or informational purposes, without implying any affiliation, endorsement, or partnership.
We make no representations or warranties, express or implied, regarding the accuracy, completeness, or suitability of any content or products presented. Nothing on this website should be construed as legal, tax, investment, financial, medical, or other professional advice. In addition, no part of this site—including articles or product references—constitutes a solicitation, recommendation, endorsement, advertisement, or offer to buy or sell any securities, franchises, or other financial instruments, particularly in jurisdictions where such activity would be unlawful.
All content is of a general nature and may not address the specific circumstances of any individual or entity. It is not a substitute for professional advice or services. Any actions you take based on the information provided here are strictly at your own risk. You accept full responsibility for any decisions or outcomes arising from your use of this website and agree to release us from any liability in connection with your use of, or reliance upon, the content or products found herein.