
|
China Resources Cement Holdings Limited (1313.HK) Valoración de DCF |
Completamente Editable: Adáptelo A Sus Necesidades En Excel O Sheets
Diseño Profesional: Plantillas Confiables Y Estándares De La Industria
Predeterminadas Para Un Uso Rápido Y Eficiente
Compatible con MAC / PC, completamente desbloqueado
No Se Necesita Experiencia; Fáciles De Seguir
China Resources Cement Holdings Limited (1313.HK) Bundle
¡Agilice su análisis y mejore la precisión con nuestra calculadora DCF (1313HK)! Utilizando datos reales de suposiciones limitadas y personalizables de China Resources Holdings, esta herramienta le permite pronosticar, analizar y valor (1313HK) al igual que un inversor profesional.
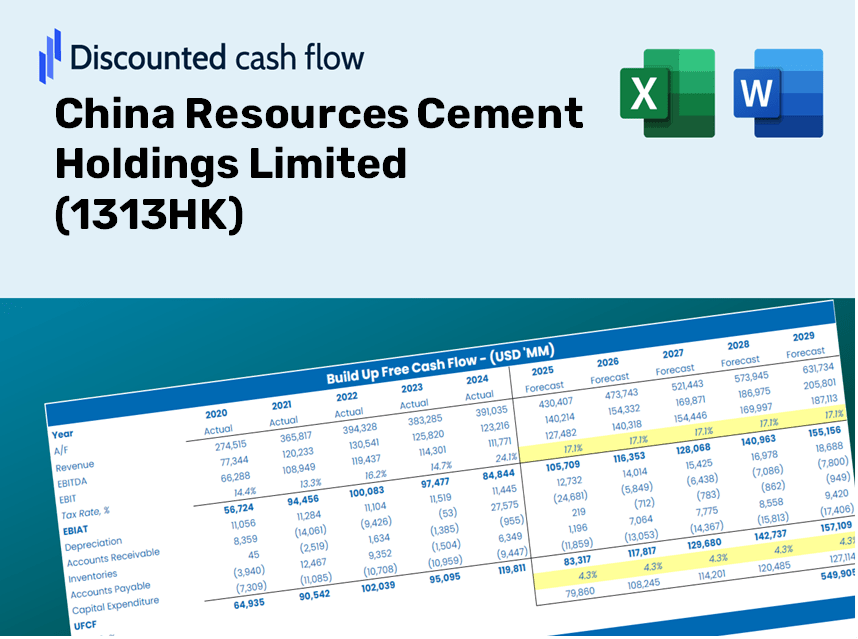
Discounted Cash Flow (DCF) - (USD MM)
| Year | AY1 2020 |
AY2 2021 |
AY3 2022 |
AY4 2023 |
AY5 2024 |
FY1 2025 |
FY2 2026 |
FY3 2027 |
FY4 2028 |
FY5 2029 |
|---|---|---|---|---|---|---|---|---|---|---|
| Revenue | 40,086.9 | 43,962.7 | 32,218.6 | 28,232.3 | 24,978.1 | 22,421.3 | 20,126.3 | 18,066.1 | 16,216.9 | 14,556.9 |
| Revenue Growth, % | 0 | 9.67 | -26.71 | -12.37 | -11.53 | -10.24 | -10.24 | -10.24 | -10.24 | -10.24 |
| EBITDA | 13,606.5 | 12,367.5 | 5,227.5 | 4,027.1 | 3,823.8 | 4,837.3 | 4,342.1 | 3,897.7 | 3,498.7 | 3,140.6 |
| EBITDA, % | 33.94 | 28.13 | 16.23 | 14.26 | 15.31 | 21.57 | 21.57 | 21.57 | 21.57 | 21.57 |
| Depreciation | 2,152.0 | 2,554.7 | 2,567.9 | 2,577.5 | 2,838.0 | 1,777.6 | 1,595.7 | 1,432.3 | 1,285.7 | 1,154.1 |
| Depreciation, % | 5.37 | 5.81 | 7.97 | 9.13 | 11.36 | 7.93 | 7.93 | 7.93 | 7.93 | 7.93 |
| EBIT | 11,454.5 | 9,812.7 | 2,659.6 | 1,449.6 | 985.7 | 3,059.7 | 2,746.5 | 2,465.3 | 2,213.0 | 1,986.5 |
| EBIT, % | 28.57 | 22.32 | 8.25 | 5.13 | 3.95 | 13.65 | 13.65 | 13.65 | 13.65 | 13.65 |
| Total Cash | 13,226.9 | 7,067.4 | 2,205.6 | 2,603.7 | 2,378.4 | 3,348.0 | 3,005.3 | 2,697.7 | 2,421.5 | 2,173.7 |
| Total Cash, percent | .0 | .0 | .0 | .0 | .0 | .0 | .0 | .0 | .0 | .0 |
| Account Receivables | 4,147.7 | 5,936.1 | 4,457.8 | 1,891.8 | 2,094.5 | 2,366.4 | 2,124.2 | 1,906.8 | 1,711.6 | 1,536.4 |
| Account Receivables, % | 10.35 | 13.5 | 13.84 | 6.7 | 8.39 | 10.55 | 10.55 | 10.55 | 10.55 | 10.55 |
| Inventories | 2,028.6 | 2,941.2 | 2,732.2 | 1,896.0 | 1,875.7 | 1,545.1 | 1,386.9 | 1,245.0 | 1,117.5 | 1,003.1 |
| Inventories, % | 5.06 | 6.69 | 8.48 | 6.72 | 7.51 | 6.89 | 6.89 | 6.89 | 6.89 | 6.89 |
| Accounts Payable | 3,723.1 | 3,786.3 | 2,895.8 | 2,978.6 | 3,260.4 | 2,264.2 | 2,032.4 | 1,824.4 | 1,637.6 | 1,470.0 |
| Accounts Payable, % | 9.29 | 8.61 | 8.99 | 10.55 | 13.05 | 10.1 | 10.1 | 10.1 | 10.1 | 10.1 |
| Capital Expenditure | -5,200.2 | -9,338.8 | -8,450.9 | -4,805.7 | -2,464.9 | -3,916.3 | -3,515.5 | -3,155.6 | -2,832.6 | -2,542.7 |
| Capital Expenditure, % | -12.97 | -21.24 | -26.23 | -17.02 | -9.87 | -17.47 | -17.47 | -17.47 | -17.47 | -17.47 |
| Tax Rate, % | 53.96 | 53.96 | 53.96 | 53.96 | 53.96 | 53.96 | 53.96 | 53.96 | 53.96 | 53.96 |
| EBITAT | 7,272.4 | 6,053.9 | 1,879.1 | 928.4 | 453.8 | 1,872.0 | 1,680.4 | 1,508.3 | 1,354.0 | 1,215.4 |
| Depreciation | ||||||||||
| Changes in Account Receivables | ||||||||||
| Changes in Inventories | ||||||||||
| Changes in Accounts Payable | ||||||||||
| Capital Expenditure | ||||||||||
| UFCF | 1,770.8 | -3,368.0 | -3,207.1 | 2,185.1 | 926.4 | -1,204.4 | -70.8 | -63.6 | -57.1 | -51.2 |
| WACC, % | 4.54 | 4.5 | 4.68 | 4.55 | 4.18 | 4.49 | 4.49 | 4.49 | 4.49 | 4.49 |
| PV UFCF | ||||||||||
| SUM PV UFCF | -1,362.2 | |||||||||
| Long Term Growth Rate, % | 0.50 | |||||||||
| Free cash flow (T + 1) | -51 | |||||||||
| Terminal Value | -1,290 | |||||||||
| Present Terminal Value | -1,036 | |||||||||
| Enterprise Value | -2,398 | |||||||||
| Net Debt | 14,129 | |||||||||
| Equity Value | -16,527 | |||||||||
| Diluted Shares Outstanding, MM | 6,983 | |||||||||
| Equity Value Per Share | -2.37 |
What You Will Receive
- Accurate 1313HK Financials: Access to both historical data and future forecasts for precise valuation.
- Customizable Inputs: Adjust parameters such as WACC, tax rates, revenue growth, and capital expenditures to fit your analysis.
- Instant Calculations: Dynamic calculations for intrinsic value and NPV at your fingertips.
- Scenario Analysis: Evaluate multiple scenarios to assess the future prospects of China Resources Cement Holdings.
- User-Friendly Design: Tailored for industry professionals while remaining approachable for newcomers.
Key Features
- Advanced DCF Calculator: Offers comprehensive unlevered and levered DCF valuation models tailored for China Resources Cement Holdings Limited (1313HK).
- WACC Calculator: Features a pre-configured Weighted Average Cost of Capital sheet with options for user-defined inputs.
- Customizable Forecast Assumptions: Adjust growth rates, capital expenditures, and discount rates as needed.
- Integrated Financial Ratios: Evaluate profitability, leverage, and efficiency ratios specific to China Resources Cement Holdings Limited (1313HK).
- Dashboard and Charts: Visual representations of key valuation metrics facilitate straightforward analysis.
How It Functions
- Obtain the Template: Gain immediate access to the Excel-based CR Cement DCF Calculator.
- Enter Your Assumptions: Modify the yellow-highlighted cells for growth rates, WACC, profit margins, and other parameters.
- Immediate Calculations: The model will automatically refresh to reflect the intrinsic value of China Resources Cement Holdings Limited (1313HK).
- Explore Scenarios: Experiment with various assumptions to assess potential changes in valuation.
- Evaluate and Decide: Utilize the outcome to inform your investment or financial assessments.
Why Opt for This Calculator?
- Time Efficiency: Skip the hassle of building a DCF model from the ground up—it’s pre-built and user-friendly.
- Enhanced Accuracy: Dependable financial data and established formulas help minimize valuation errors.
- Completely Customizable: Adjust the model to align with your specific assumptions and forecasts.
- User-Friendly Interface: Intuitive charts and outputs simplify the analysis of results.
- Preferred by Professionals: Crafted for experts who prioritize both precision and usability.
Who Can Benefit from This Product?
- Finance Students: Master valuation techniques and apply them to real-world data.
- Academics: Use professional models in your curriculum or research projects.
- Investors: Validate your assumptions and evaluate valuation outcomes for China Resources Cement Holdings Limited (1313HK).
- Analysts: Enhance your efficiency with a customizable, pre-built DCF model.
- Small Business Owners: Understand the evaluation methods used for large public companies like China Resources Cement Holdings Limited (1313HK).
Contents of the Template
- Preloaded 1313HK Data: Historical and projected financial metrics, including revenue, EBIT, and capital expenditures.
- DCF and WACC Models: Advanced spreadsheets for calculating intrinsic value and Weighted Average Cost of Capital.
- Editable Inputs: Yellow-highlighted fields for tweaking revenue growth, tax rates, and discount rates.
- Financial Statements: Detailed annual and quarterly financial reports for in-depth analysis.
- Key Ratios: Metrics for profitability, leverage, and efficiency to assess performance.
- Dashboard and Charts: Visual representations of valuation results and underlying assumptions.
Disclaimer
All information, articles, and product details provided on this website are for general informational and educational purposes only. We do not claim any ownership over, nor do we intend to infringe upon, any trademarks, copyrights, logos, brand names, or other intellectual property mentioned or depicted on this site. Such intellectual property remains the property of its respective owners, and any references here are made solely for identification or informational purposes, without implying any affiliation, endorsement, or partnership.
We make no representations or warranties, express or implied, regarding the accuracy, completeness, or suitability of any content or products presented. Nothing on this website should be construed as legal, tax, investment, financial, medical, or other professional advice. In addition, no part of this site—including articles or product references—constitutes a solicitation, recommendation, endorsement, advertisement, or offer to buy or sell any securities, franchises, or other financial instruments, particularly in jurisdictions where such activity would be unlawful.
All content is of a general nature and may not address the specific circumstances of any individual or entity. It is not a substitute for professional advice or services. Any actions you take based on the information provided here are strictly at your own risk. You accept full responsibility for any decisions or outcomes arising from your use of this website and agree to release us from any liability in connection with your use of, or reliance upon, the content or products found herein.