
|
Hua Hong Semiconductor Limited (1347.HK) Valoración de DCF |
Completamente Editable: Adáptelo A Sus Necesidades En Excel O Sheets
Diseño Profesional: Plantillas Confiables Y Estándares De La Industria
Predeterminadas Para Un Uso Rápido Y Eficiente
Compatible con MAC / PC, completamente desbloqueado
No Se Necesita Experiencia; Fáciles De Seguir
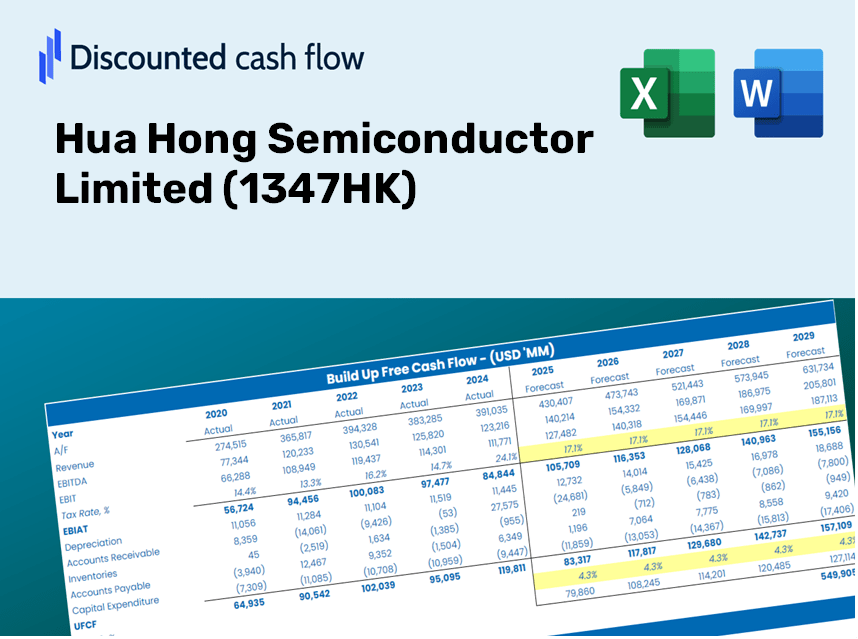
Hua Hong Semiconductor Limited (1347.HK) Bundle
Diseñada para la precisión, nuestra calculadora DCF (1347HK) le permite evaluar la valoración de Hua Hong Semiconductor Limited utilizando datos financieros del mundo real, ofreciendo una flexibilidad completa para modificar todos los parámetros esenciales para las proyecciones mejoradas.
Discounted Cash Flow (DCF) - (USD MM)
| Year | AY1 2020 |
AY2 2021 |
AY3 2022 |
AY4 2023 |
AY5 2024 |
FY1 2025 |
FY2 2026 |
FY3 2027 |
FY4 2028 |
FY5 2029 |
|---|---|---|---|---|---|---|---|---|---|---|
| Revenue | 7,469.7 | 12,672.0 | 19,236.1 | 17,764.5 | 15,572.3 | 19,521.9 | 24,473.3 | 30,680.6 | 38,462.3 | 48,217.7 |
| Revenue Growth, % | 0 | 69.64 | 51.8 | -7.65 | -12.34 | 25.36 | 25.36 | 25.36 | 25.36 | 25.36 |
| EBITDA | 1,984.6 | 4,876.5 | 7,718.2 | 6,018.5 | 2,991.7 | 6,179.3 | 7,746.6 | 9,711.4 | 12,174.6 | 15,262.5 |
| EBITDA, % | 26.57 | 38.48 | 40.12 | 33.88 | 19.21 | 31.65 | 31.65 | 31.65 | 31.65 | 31.65 |
| Depreciation | 1,603.5 | 2,471.2 | 3,550.1 | 3,888.7 | 4,202.2 | 4,228.4 | 5,300.9 | 6,645.3 | 8,330.8 | 10,443.8 |
| Depreciation, % | 21.47 | 19.5 | 18.46 | 21.89 | 26.99 | 21.66 | 21.66 | 21.66 | 21.66 | 21.66 |
| EBIT | 381.1 | 2,405.4 | 4,168.2 | 2,129.7 | -1,210.5 | 1,950.9 | 2,445.8 | 3,066.1 | 3,843.8 | 4,818.7 |
| EBIT, % | 5.1 | 18.98 | 21.67 | 11.99 | -7.77 | 9.99 | 9.99 | 9.99 | 9.99 | 9.99 |
| Total Cash | 7,170.6 | 12,511.8 | 15,609.3 | 43,400.3 | 34,650.2 | 18,580.1 | 23,292.6 | 29,200.5 | 36,606.7 | 45,891.4 |
| Total Cash, percent | .0 | .0 | .0 | .0 | .0 | .0 | .0 | .0 | .0 | .0 |
| Account Receivables | 976.4 | 1,411.1 | 2,283.5 | 2,198.7 | 2,500.0 | 2,518.7 | 3,157.6 | 3,958.4 | 4,962.4 | 6,221.1 |
| Account Receivables, % | 13.07 | 11.14 | 11.87 | 12.38 | 16.05 | 12.9 | 12.9 | 12.9 | 12.9 | 12.9 |
| Inventories | 1,759.9 | 4,253.7 | 5,538.8 | 4,884.4 | 5,353.7 | 5,770.5 | 7,234.1 | 9,069.0 | 11,369.2 | 14,252.8 |
| Inventories, % | 23.56 | 33.57 | 28.79 | 27.5 | 34.38 | 29.56 | 29.56 | 29.56 | 29.56 | 29.56 |
| Accounts Payable | 1,106.8 | 1,564.9 | 1,888.0 | 1,829.3 | 2,318.5 | 2,427.3 | 3,042.9 | 3,814.7 | 4,782.2 | 5,995.1 |
| Accounts Payable, % | 14.82 | 12.35 | 9.81 | 10.3 | 14.89 | 12.43 | 12.43 | 12.43 | 12.43 | 12.43 |
| Capital Expenditure | -8,448.7 | -7,295.9 | -7,740.9 | -7,044.9 | -21,601.2 | -13,176.3 | -16,518.2 | -20,707.8 | -25,960.1 | -32,544.4 |
| Capital Expenditure, % | -113.11 | -57.58 | -40.24 | -39.66 | -138.72 | -67.49 | -67.49 | -67.49 | -67.49 | -67.49 |
| Tax Rate, % | 143.43 | 143.43 | 143.43 | 143.43 | 143.43 | 143.43 | 143.43 | 143.43 | 143.43 | 143.43 |
| EBITAT | 822.5 | 2,122.5 | 3,780.3 | 3,435.9 | 525.7 | 1,478.6 | 1,853.6 | 2,323.7 | 2,913.1 | 3,651.9 |
| Depreciation | ||||||||||
| Changes in Account Receivables | ||||||||||
| Changes in Inventories | ||||||||||
| Changes in Accounts Payable | ||||||||||
| Capital Expenditure | ||||||||||
| UFCF | -7,652.2 | -5,172.6 | -2,244.9 | 960.1 | -17,154.6 | -7,796.1 | -10,850.6 | -13,602.7 | -17,052.8 | -21,378.0 |
| WACC, % | 8.44 | 8.38 | 8.4 | 8.44 | 7.94 | 8.32 | 8.32 | 8.32 | 8.32 | 8.32 |
| PV UFCF | ||||||||||
| SUM PV UFCF | -53,867.1 | |||||||||
| Long Term Growth Rate, % | 2.00 | |||||||||
| Free cash flow (T + 1) | -21,806 | |||||||||
| Terminal Value | -344,906 | |||||||||
| Present Terminal Value | -231,267 | |||||||||
| Enterprise Value | -285,134 | |||||||||
| Net Debt | -17,392 | |||||||||
| Equity Value | -267,742 | |||||||||
| Diluted Shares Outstanding, MM | 1,721 | |||||||||
| Equity Value Per Share | -155.57 |
What You Will Receive
- Authentic Hua Hong Semiconductor Data: Pre-loaded financial metrics – from revenue to EBIT – based on actual and projected figures.
- Comprehensive Customization: Modify all key parameters (yellow cells) such as WACC, growth %, and tax rates.
- Immediate Valuation Adjustments: Automatic recalculations to evaluate the effects of changes on Hua Hong Semiconductor's fair value.
- Flexible Excel Template: Designed for quick modifications, scenario analysis, and in-depth projections.
- Efficient and Precise: Avoid building models from the ground up while ensuring accuracy and adaptability.
Key Features
- Customizable Forecast Inputs: Adjust essential parameters such as revenue growth, EBITDA %, and capital expenditures tailored for Hua Hong Semiconductor Limited (1347HK).
- Instant DCF Valuation: Provides immediate calculations of intrinsic value, NPV, and various financial metrics.
- High-Precision Accuracy: Incorporates Hua Hong Semiconductor Limited’s (1347HK) actual financial data to ensure realistic valuation results.
- Seamless Scenario Analysis: Effortlessly test various assumptions and evaluate different outcomes.
- Efficiency Booster: Avoid the complexities of building intricate valuation models from the ground up.
How It Works
- Download the Template: Gain immediate access to the Excel-based HHSL DCF Calculator for Hua Hong Semiconductor Limited (1347HK).
- Input Your Assumptions: Modify the cells highlighted in yellow for growth rates, WACC, profit margins, and additional parameters.
- Instant Calculations: The model will automatically update the intrinsic value of Hua Hong Semiconductor Limited (1347HK).
- Test Scenarios: Experiment with different assumptions to assess the potential changes in valuation.
- Analyze and Decide: Utilize the outcomes to inform your investment choices or financial analysis.
Why Opt for This Calculator?
- Designed for Experts: A sophisticated tool utilized by analysts, CFOs, and consultants in the field.
- Accurate Data: Historical and projected financials for Hua Hong Semiconductor Limited (1347HK) are preloaded to ensure precision.
- Forecast Simulation: Effortlessly test various scenarios and assumptions.
- Transparent Outputs: Instantly computes intrinsic value, NPV, and essential metrics.
- User-Friendly: Comprehensive step-by-step instructions simplify the process.
Who Should Use This Product?
- Finance Students: Master valuation methods and practice them with actual data.
- Academics: Utilize industry-standard models in your teaching or research projects.
- Investors: Validate your assumptions and assess valuation scenarios for Hua Hong Semiconductor Limited (1347HK).
- Analysts: Enhance your efficiency with a ready-to-use, customizable DCF model.
- Small Business Owners: Discover how major public companies like Hua Hong Semiconductor Limited (1347HK) are evaluated.
What the Template Includes
- Pre-Filled Data: Contains Hua Hong Semiconductor Limited's historical financial information and forecasts.
- Discounted Cash Flow Model: An editable DCF valuation model featuring automatic calculations.
- Weighted Average Cost of Capital (WACC): A specialized sheet for calculating WACC with customizable inputs.
- Key Financial Ratios: Evaluate Hua Hong's profitability, efficiency, and leverage metrics.
- Customizable Inputs: Easily adjust revenue growth, profit margins, and tax rates.
- Clear Dashboard: Visual displays and tables summarizing essential valuation outcomes.
Disclaimer
All information, articles, and product details provided on this website are for general informational and educational purposes only. We do not claim any ownership over, nor do we intend to infringe upon, any trademarks, copyrights, logos, brand names, or other intellectual property mentioned or depicted on this site. Such intellectual property remains the property of its respective owners, and any references here are made solely for identification or informational purposes, without implying any affiliation, endorsement, or partnership.
We make no representations or warranties, express or implied, regarding the accuracy, completeness, or suitability of any content or products presented. Nothing on this website should be construed as legal, tax, investment, financial, medical, or other professional advice. In addition, no part of this site—including articles or product references—constitutes a solicitation, recommendation, endorsement, advertisement, or offer to buy or sell any securities, franchises, or other financial instruments, particularly in jurisdictions where such activity would be unlawful.
All content is of a general nature and may not address the specific circumstances of any individual or entity. It is not a substitute for professional advice or services. Any actions you take based on the information provided here are strictly at your own risk. You accept full responsibility for any decisions or outcomes arising from your use of this website and agree to release us from any liability in connection with your use of, or reliance upon, the content or products found herein.