
|
XTEP International Holdings Limited (1368.HK) DCF Valoración |
Completamente Editable: Adáptelo A Sus Necesidades En Excel O Sheets
Diseño Profesional: Plantillas Confiables Y Estándares De La Industria
Predeterminadas Para Un Uso Rápido Y Eficiente
Compatible con MAC / PC, completamente desbloqueado
No Se Necesita Experiencia; Fáciles De Seguir
Xtep International Holdings Limited (1368.HK) Bundle
¡Explore las perspectivas financieras de XTEP International Holdings Limited (1368HK) utilizando nuestra calculadora DCF fácil de usar! Ingrese sus suposiciones para el crecimiento, los márgenes y los gastos para calcular el valor intrínseco de XTEP International Holdings Limited (1368HK) y mejorar su enfoque de inversión.
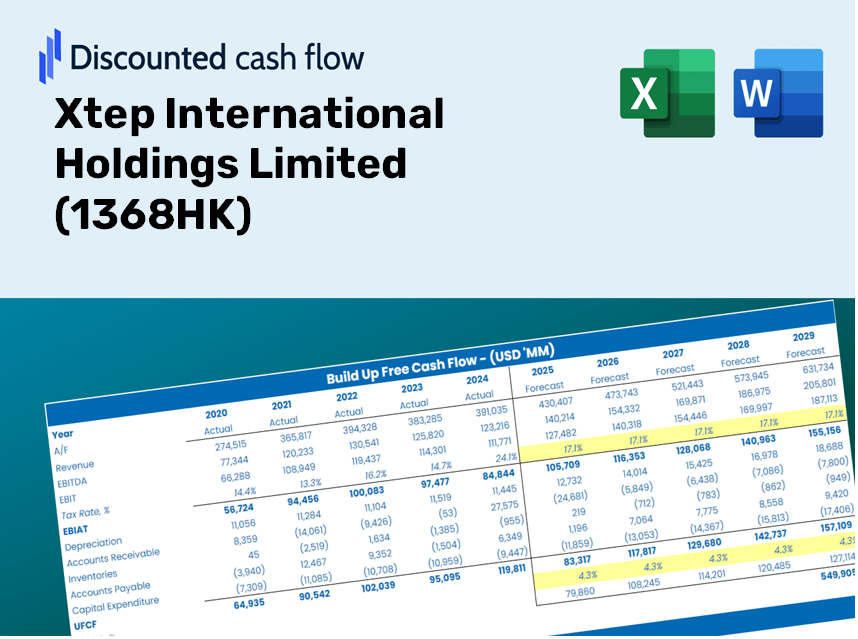
Discounted Cash Flow (DCF) - (USD MM)
| Year | AY1 2020 |
AY2 2021 |
AY3 2022 |
AY4 2023 |
AY5 2024 |
FY1 2025 |
FY2 2026 |
FY3 2027 |
FY4 2028 |
FY5 2029 |
|---|---|---|---|---|---|---|---|---|---|---|
| Revenue | 8,935.2 | 10,948.5 | 14,138.1 | 15,685.4 | 14,845.3 | 16,970.2 | 19,399.2 | 22,175.9 | 25,350.0 | 28,978.5 |
| Revenue Growth, % | 0 | 22.53 | 29.13 | 10.94 | -5.36 | 14.31 | 14.31 | 14.31 | 14.31 | 14.31 |
| EBITDA | 1,141.3 | 1,690.2 | 1,885.9 | 2,113.7 | 2,288.8 | 2,390.9 | 2,733.1 | 3,124.3 | 3,571.5 | 4,082.7 |
| EBITDA, % | 12.77 | 15.44 | 13.34 | 13.48 | 15.42 | 14.09 | 14.09 | 14.09 | 14.09 | 14.09 |
| Depreciation | 181.1 | 185.2 | 263.8 | 333.5 | 206.4 | 308.9 | 353.1 | 403.6 | 461.4 | 527.5 |
| Depreciation, % | 2.03 | 1.69 | 1.87 | 2.13 | 1.39 | 1.82 | 1.82 | 1.82 | 1.82 | 1.82 |
| EBIT | 960.3 | 1,505.0 | 1,622.1 | 1,780.2 | 2,082.4 | 2,082.0 | 2,380.0 | 2,720.7 | 3,110.1 | 3,555.3 |
| EBIT, % | 10.75 | 13.75 | 11.47 | 11.35 | 14.03 | 12.27 | 12.27 | 12.27 | 12.27 | 12.27 |
| Total Cash | 3,796.2 | 4,296.8 | 4,280.1 | 3,602.3 | 3,257.4 | 5,325.7 | 6,088.0 | 6,959.5 | 7,955.6 | 9,094.3 |
| Total Cash, percent | .0 | .0 | .0 | .0 | .0 | .0 | .0 | .0 | .0 | .0 |
| Account Receivables | 3,538.0 | 3,857.8 | 4,606.1 | 5,440.1 | 6,623.4 | 6,337.0 | 7,244.1 | 8,280.9 | 9,466.2 | 10,821.2 |
| Account Receivables, % | 39.6 | 35.24 | 32.58 | 34.68 | 44.62 | 37.34 | 37.34 | 37.34 | 37.34 | 37.34 |
| Inventories | 1,065.8 | 1,637.3 | 2,500.8 | 1,961.3 | 1,744.7 | 2,336.1 | 2,670.4 | 3,052.6 | 3,489.6 | 3,989.1 |
| Inventories, % | 11.93 | 14.95 | 17.69 | 12.5 | 11.75 | 13.77 | 13.77 | 13.77 | 13.77 | 13.77 |
| Accounts Payable | 1,617.0 | 2,572.1 | 3,030.7 | 2,766.8 | 2,400.5 | 3,286.6 | 3,757.1 | 4,294.8 | 4,909.6 | 5,612.3 |
| Accounts Payable, % | 18.1 | 23.49 | 21.44 | 17.64 | 16.17 | 19.37 | 19.37 | 19.37 | 19.37 | 19.37 |
| Capital Expenditure | -230.8 | -729.7 | -414.2 | -542.0 | -348.3 | -610.2 | -697.5 | -797.4 | -911.5 | -1,042.0 |
| Capital Expenditure, % | -2.58 | -6.67 | -2.93 | -3.46 | -2.35 | -3.6 | -3.6 | -3.6 | -3.6 | -3.6 |
| Tax Rate, % | 34.87 | 34.87 | 34.87 | 34.87 | 34.87 | 34.87 | 34.87 | 34.87 | 34.87 | 34.87 |
| EBITAT | 646.8 | 1,062.3 | 1,098.5 | 1,265.3 | 1,356.3 | 1,423.6 | 1,627.3 | 1,860.3 | 2,126.5 | 2,430.9 |
| Depreciation | ||||||||||
| Changes in Account Receivables | ||||||||||
| Changes in Inventories | ||||||||||
| Changes in Accounts Payable | ||||||||||
| Capital Expenditure | ||||||||||
| UFCF | -2,389.7 | 581.8 | -205.1 | 498.4 | -118.6 | 1,703.5 | 511.9 | 585.2 | 668.9 | 764.7 |
| WACC, % | 6.83 | 6.85 | 6.83 | 6.85 | 6.81 | 6.83 | 6.83 | 6.83 | 6.83 | 6.83 |
| PV UFCF | ||||||||||
| SUM PV UFCF | 3,585.9 | |||||||||
| Long Term Growth Rate, % | 3.50 | |||||||||
| Free cash flow (T + 1) | 791 | |||||||||
| Terminal Value | 23,740 | |||||||||
| Present Terminal Value | 17,058 | |||||||||
| Enterprise Value | 20,644 | |||||||||
| Net Debt | 132 | |||||||||
| Equity Value | 20,512 | |||||||||
| Diluted Shares Outstanding, MM | 2,655 | |||||||||
| Equity Value Per Share | 7.72 |
What You Will Receive
- Genuine Xtep Data: Preloaded financial details – covering everything from revenue to EBIT – derived from actual and projected figures.
- Comprehensive Customization: Modify all key parameters (yellow cells) such as WACC, growth %, and tax rates as needed.
- Instant Valuation Adjustments: Automatic recalculations to assess how changes affect Xtep's fair value.
- Flexible Excel Template: Designed for easy edits, scenario analysis, and detailed forecasting.
- Efficient and Precise: Eliminate the need to create models from the ground up while ensuring accuracy and adaptability.
Key Features
- Pre-Loaded Data: Xtep International Holdings Limited’s historical financial statements and pre-filled forecasts.
- Fully Adjustable Inputs: Modify WACC, tax rates, revenue growth, and EBITDA margins to suit your analysis.
- Instant Results: Watch Xtep’s intrinsic value recalculate in real time.
- Clear Visual Outputs: Dashboard charts present valuation results and key metrics effectively.
- Built for Accuracy: A professional-grade tool designed for analysts, investors, and financial experts.
How It Works
- Step 1: Download the ready-to-use Excel template featuring data for Xtep International Holdings Limited (1368HK).
- Step 2: Review the pre-filled sheets to familiarize yourself with essential metrics.
- Step 3: Modify forecasts and assumptions in the editable yellow cells (WACC, growth, margins).
- Step 4: Instantly see recalculated results, including the intrinsic value of Xtep International Holdings Limited (1368HK).
- Step 5: Make well-informed investment decisions or create reports using the generated outputs.
Why Choose This Calculator for Xtep International Holdings Limited (1368HK)?
- Accurate Data: Utilize real financial insights from Xtep for dependable valuation outcomes.
- Customizable: Modify essential parameters such as growth rates, WACC, and tax rates to align with your forecasts.
- Time-Saving: Ready-made calculations mean you won’t have to start from the ground up.
- Professional-Grade Tool: Tailored for investors, analysts, and consultants in the field.
- User-Friendly: An intuitive design paired with clear step-by-step guidance makes it accessible for everyone.
Who Can Benefit from This Product?
- Professional Investors: Create comprehensive and trustworthy valuation models for portfolio assessments related to Xtep International Holdings Limited (1368HK).
- Corporate Finance Teams: Evaluate valuation scenarios to inform internal strategies regarding Xtep International Holdings Limited (1368HK).
- Consultants and Advisors: Deliver precise valuation insights to clients focused on Xtep International Holdings Limited (1368HK).
- Students and Educators: Leverage real-world data to enhance learning and practice in financial modeling with Xtep International Holdings Limited (1368HK).
- Sportswear Enthusiasts: Gain insights into how sportswear companies like Xtep International Holdings Limited (1368HK) are valued in the market.
What the Template Includes
- Preloaded Xtep Data: Historical and projected financial metrics, such as revenue, EBIT, and capital expenditures.
- DCF and WACC Models: Advanced templates for determining intrinsic value and Weighted Average Cost of Capital.
- Editable Inputs: Cells highlighted in yellow for modifying revenue growth, tax rates, and discount rates.
- Financial Statements: Detailed annual and quarterly financial reports for thorough analysis.
- Key Ratios: Ratios covering profitability, leverage, and efficiency to assess performance.
- Dashboard and Charts: Visual representations of valuation results and underlying assumptions.
Disclaimer
All information, articles, and product details provided on this website are for general informational and educational purposes only. We do not claim any ownership over, nor do we intend to infringe upon, any trademarks, copyrights, logos, brand names, or other intellectual property mentioned or depicted on this site. Such intellectual property remains the property of its respective owners, and any references here are made solely for identification or informational purposes, without implying any affiliation, endorsement, or partnership.
We make no representations or warranties, express or implied, regarding the accuracy, completeness, or suitability of any content or products presented. Nothing on this website should be construed as legal, tax, investment, financial, medical, or other professional advice. In addition, no part of this site—including articles or product references—constitutes a solicitation, recommendation, endorsement, advertisement, or offer to buy or sell any securities, franchises, or other financial instruments, particularly in jurisdictions where such activity would be unlawful.
All content is of a general nature and may not address the specific circumstances of any individual or entity. It is not a substitute for professional advice or services. Any actions you take based on the information provided here are strictly at your own risk. You accept full responsibility for any decisions or outcomes arising from your use of this website and agree to release us from any liability in connection with your use of, or reliance upon, the content or products found herein.