
|
DPC Dash Ltd (1405.HK) Valoración de DCF |
Completamente Editable: Adáptelo A Sus Necesidades En Excel O Sheets
Diseño Profesional: Plantillas Confiables Y Estándares De La Industria
Predeterminadas Para Un Uso Rápido Y Eficiente
Compatible con MAC / PC, completamente desbloqueado
No Se Necesita Experiencia; Fáciles De Seguir
DPC Dash Ltd (1405.HK) Bundle
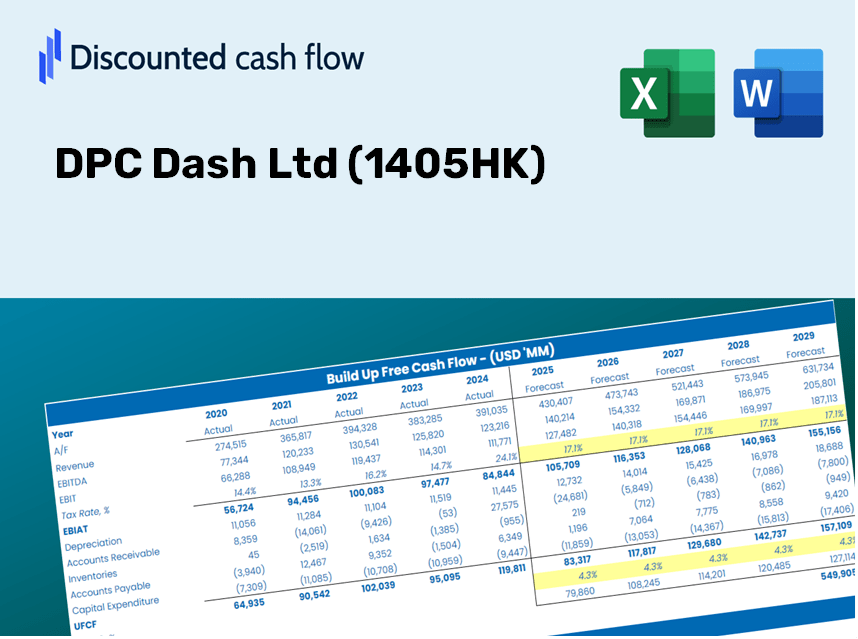
¡Simplifique la valoración de DPC Dash Ltd (1405HK) con esta calculadora DCF personalizable! Con el Real DPC Dash Ltd (1405HK) finanzas y entradas de pronóstico ajustables, puede probar escenarios y descubrir el valor razonable DPC Dash Ltd (1405HK) en minutos.
Discounted Cash Flow (DCF) - (USD MM)
| Year | AY1 2020 |
AY2 2021 |
AY3 2022 |
AY4 2023 |
AY5 2024 |
FY1 2025 |
FY2 2026 |
FY3 2027 |
FY4 2028 |
FY5 2029 |
|---|---|---|---|---|---|---|---|---|---|---|
| Revenue | 1,206.3 | 1,760.6 | 2,208.0 | 3,333.3 | 4,713.7 | 6,643.2 | 9,362.6 | 13,195.1 | 18,596.5 | 26,208.8 |
| Revenue Growth, % | 0 | 45.95 | 25.41 | 50.97 | 41.41 | 40.93 | 40.93 | 40.93 | 40.93 | 40.93 |
| EBITDA | 41.3 | -110.5 | 244.5 | 567.2 | 454.9 | 463.5 | 653.2 | 920.6 | 1,297.4 | 1,828.5 |
| EBITDA, % | 3.42 | -6.28 | 11.08 | 17.02 | 9.65 | 6.98 | 6.98 | 6.98 | 6.98 | 6.98 |
| Depreciation | 268.3 | 331.9 | 392.0 | 488.6 | 287.1 | 1,057.6 | 1,490.5 | 2,100.6 | 2,960.4 | 4,172.3 |
| Depreciation, % | 22.24 | 18.85 | 17.76 | 14.66 | 6.09 | 15.92 | 15.92 | 15.92 | 15.92 | 15.92 |
| EBIT | -227.1 | -442.4 | -147.5 | 78.6 | 167.8 | -594.1 | -837.3 | -1,180.0 | -1,663.0 | -2,343.8 |
| EBIT, % | -18.82 | -25.13 | -6.68 | 2.36 | 3.56 | -8.94 | -8.94 | -8.94 | -8.94 | -8.94 |
| Total Cash | 281.2 | 717.5 | 594.9 | 1,113.7 | 1,168.4 | 1,982.4 | 2,793.9 | 3,937.6 | 5,549.4 | 7,821.0 |
| Total Cash, percent | .0 | .0 | .0 | .0 | .0 | .0 | .0 | .0 | .0 | .0 |
| Account Receivables | 4.0 | 5.0 | 9.1 | 10.7 | 18.9 | 23.2 | 32.7 | 46.1 | 64.9 | 91.5 |
| Account Receivables, % | 0.32879 | 0.2843 | 0.41029 | 0.31966 | 0.40198 | 0.349 | 0.349 | 0.349 | 0.349 | 0.349 |
| Inventories | 44.7 | 51.7 | 73.1 | 80.7 | 125.2 | 199.7 | 281.5 | 396.7 | 559.1 | 787.9 |
| Inventories, % | 3.71 | 2.94 | 3.31 | 2.42 | 2.66 | 3.01 | 3.01 | 3.01 | 3.01 | 3.01 |
| Accounts Payable | 80.6 | 136.2 | 138.5 | 168.2 | 271.7 | 418.5 | 589.8 | 831.3 | 1,171.5 | 1,651.1 |
| Accounts Payable, % | 6.68 | 7.74 | 6.27 | 5.04 | 5.76 | 6.3 | 6.3 | 6.3 | 6.3 | 6.3 |
| Capital Expenditure | -173.1 | -201.9 | -230.1 | -345.5 | -407.7 | -734.2 | -1,034.7 | -1,458.3 | -2,055.2 | -2,896.5 |
| Capital Expenditure, % | -14.35 | -11.47 | -10.42 | -10.36 | -8.65 | -11.05 | -11.05 | -11.05 | -11.05 | -11.05 |
| Tax Rate, % | 44.59 | 44.59 | 44.59 | 44.59 | 44.59 | 44.59 | 44.59 | 44.59 | 44.59 | 44.59 |
| EBITAT | -232.5 | -435.9 | -163.5 | -919.0 | 93.0 | -420.5 | -592.7 | -835.3 | -1,177.2 | -1,659.1 |
| Depreciation | ||||||||||
| Changes in Account Receivables | ||||||||||
| Changes in Inventories | ||||||||||
| Changes in Accounts Payable | ||||||||||
| Capital Expenditure | ||||||||||
| UFCF | -105.4 | -258.3 | -24.7 | -755.5 | 23.2 | -29.1 | -56.9 | -80.2 | -113.0 | -159.3 |
| WACC, % | 4.72 | 4.71 | 4.72 | 4.04 | 4.41 | 4.52 | 4.52 | 4.52 | 4.52 | 4.52 |
| PV UFCF | ||||||||||
| SUM PV UFCF | -372.6 | |||||||||
| Long Term Growth Rate, % | 2.00 | |||||||||
| Free cash flow (T + 1) | -162 | |||||||||
| Terminal Value | -6,452 | |||||||||
| Present Terminal Value | -5,173 | |||||||||
| Enterprise Value | -5,546 | |||||||||
| Net Debt | 545 | |||||||||
| Equity Value | -6,091 | |||||||||
| Diluted Shares Outstanding, MM | 132 | |||||||||
| Equity Value Per Share | -46.15 |
Benefits You Will Receive
- Comprehensive Financial Model: Utilize DPC Dash Ltd’s actual data for accurate DCF valuations.
- Complete Forecast Customization: Modify revenue growth, profit margins, WACC, and other essential variables.
- Real-Time Calculations: Experience immediate updates to results as adjustments are made.
- Professional-Grade Template: A polished Excel document crafted for high-quality valuations.
- Flexible and Reusable: Designed for adaptability, allowing multiple uses for in-depth forecasts.
Key Features
- Pre-Loaded Data: DPC Dash Ltd’s historical financial statements and pre-filled forecasts.
- Fully Adjustable Inputs: Modify WACC, tax rates, revenue growth, and EBITDA margins as needed.
- Instant Results: Watch DPC Dash Ltd’s intrinsic value update in real-time.
- Clear Visual Outputs: Dashboard charts illustrate valuation results and essential metrics.
- Built for Accuracy: A professional tool designed for analysts, investors, and finance professionals.
How It Functions
- 1. Access the Template: Download and open the Excel file containing DPC Dash Ltd's (1405HK) preloaded data.
- 2. Adjust Key Inputs: Modify essential parameters such as growth rates, WACC, and capital expenditures.
- 3. Instant Results: The DCF model automatically computes the intrinsic value and NPV in real-time.
- 4. Explore Various Scenarios: Analyze different valuation outcomes by comparing multiple forecasts.
- 5. Present with Assurance: Deliver professional valuation insights to bolster your decision-making process.
Why Opt for DPC Dash Ltd (1405HK) Calculator?
- User-Friendly Design: Perfect for both novice and seasoned users.
- Customizable Inputs: Easily adjust parameters to fit your analysis needs.
- Real-Time Updates: Instantly see how changes affect DPC Dash Ltd’s (1405HK) valuation.
- Preloaded Data: Comes equipped with DPC Dash Ltd’s (1405HK) actual financial figures for swift assessments.
- Endorsed by Experts: A go-to tool for investors and analysts making strategic choices.
Who is This Product Suitable For?
- Investors: Gain assurance in your investment choices with our advanced valuation software.
- Financial Analysts: Optimize your workflow with an easily customizable pre-formatted DCF model.
- Consultants: Effortlessly modify the template to suit client presentations or reports.
- Finance Enthusiasts: Enhance your knowledge of valuation strategies through practical, real-life examples.
- Educators and Students: Utilize it as a hands-on educational resource in finance courses.
Contents of the Template
- Preloaded DPC Dash Ltd Data: Historical and projected financial metrics, including revenue, EBIT, and capital expenditures.
- DCF and WACC Models: Advanced sheets for determining intrinsic value and Weighted Average Cost of Capital.
- Editable Inputs: Yellow-highlighted cells for modifying revenue growth, tax rates, and discount rates.
- Financial Statements: Detailed annual and quarterly financials for in-depth analysis.
- Key Ratios: Ratios on profitability, leverage, and efficiency for performance assessment.
- Dashboard and Charts: Visual representations of valuation results and underlying assumptions.
Disclaimer
All information, articles, and product details provided on this website are for general informational and educational purposes only. We do not claim any ownership over, nor do we intend to infringe upon, any trademarks, copyrights, logos, brand names, or other intellectual property mentioned or depicted on this site. Such intellectual property remains the property of its respective owners, and any references here are made solely for identification or informational purposes, without implying any affiliation, endorsement, or partnership.
We make no representations or warranties, express or implied, regarding the accuracy, completeness, or suitability of any content or products presented. Nothing on this website should be construed as legal, tax, investment, financial, medical, or other professional advice. In addition, no part of this site—including articles or product references—constitutes a solicitation, recommendation, endorsement, advertisement, or offer to buy or sell any securities, franchises, or other financial instruments, particularly in jurisdictions where such activity would be unlawful.
All content is of a general nature and may not address the specific circumstances of any individual or entity. It is not a substitute for professional advice or services. Any actions you take based on the information provided here are strictly at your own risk. You accept full responsibility for any decisions or outcomes arising from your use of this website and agree to release us from any liability in connection with your use of, or reliance upon, the content or products found herein.