
|
Q Technology Company Limited (1478.HK) Valoración de DCF |
Completamente Editable: Adáptelo A Sus Necesidades En Excel O Sheets
Diseño Profesional: Plantillas Confiables Y Estándares De La Industria
Predeterminadas Para Un Uso Rápido Y Eficiente
Compatible con MAC / PC, completamente desbloqueado
No Se Necesita Experiencia; Fáciles De Seguir
Q Technology (Group) Company Limited (1478.HK) Bundle
¡Agilice su análisis y mejore la precisión con nuestra calculadora DCF (1478HK)! Utilizando datos genuinos de Q Technology (Group) Company Limited y personalizable supuestos, esta herramienta le permite pronosticar, analizar y valor (1478HK) como un inversor experimentado.
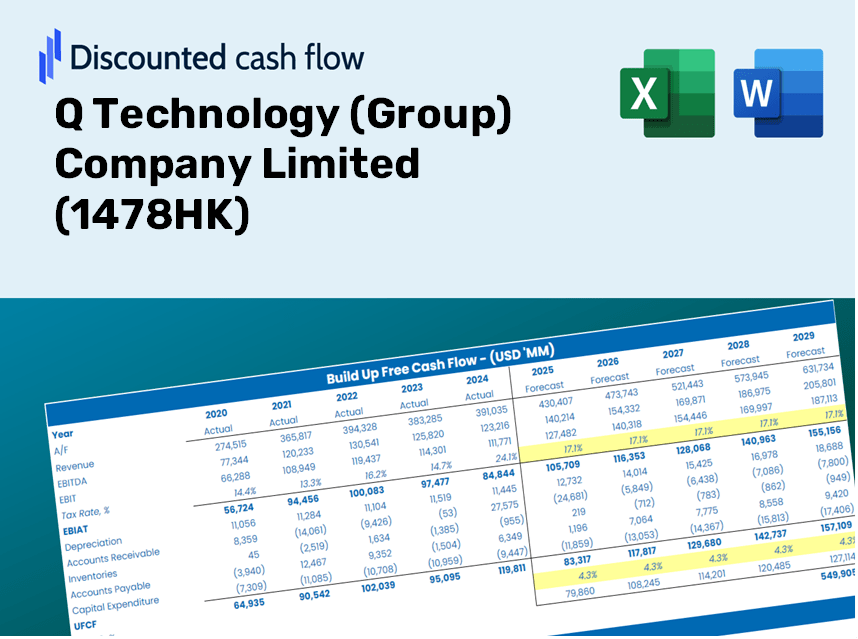
Discounted Cash Flow (DCF) - (USD MM)
| Year | AY1 2020 |
AY2 2021 |
AY3 2022 |
AY4 2023 |
AY5 2024 |
FY1 2025 |
FY2 2026 |
FY3 2027 |
FY4 2028 |
FY5 2029 |
|---|---|---|---|---|---|---|---|---|---|---|
| Revenue | 19,016.2 | 20,395.6 | 15,036.9 | 13,694.4 | 17,651.2 | 20,664.7 | 24,192.9 | 28,323.3 | 33,159.0 | 38,820.2 |
| Revenue Growth, % | 0 | 7.25 | -26.27 | -8.93 | 28.89 | 17.07 | 17.07 | 17.07 | 17.07 | 17.07 |
| EBITDA | 1,608.0 | 1,679.0 | 692.7 | 746.5 | 826.7 | 1,299.0 | 1,520.7 | 1,780.4 | 2,084.3 | 2,440.2 |
| EBITDA, % | 8.46 | 8.23 | 4.61 | 5.45 | 4.68 | 6.29 | 6.29 | 6.29 | 6.29 | 6.29 |
| Depreciation | 389.3 | 508.8 | 510.3 | 484.8 | 382.2 | 563.8 | 660.0 | 772.7 | 904.6 | 1,059.1 |
| Depreciation, % | 2.05 | 2.49 | 3.39 | 3.54 | 2.17 | 2.73 | 2.73 | 2.73 | 2.73 | 2.73 |
| EBIT | 1,218.6 | 1,170.2 | 182.5 | 261.7 | 444.6 | 735.2 | 860.7 | 1,007.7 | 1,179.7 | 1,381.1 |
| EBIT, % | 6.41 | 5.74 | 1.21 | 1.91 | 2.52 | 3.56 | 3.56 | 3.56 | 3.56 | 3.56 |
| Total Cash | 2,277.0 | 1,961.0 | 3,325.8 | 4,177.4 | 3,191.8 | 3,814.4 | 4,465.7 | 5,228.1 | 6,120.7 | 7,165.7 |
| Total Cash, percent | .0 | .0 | .0 | .0 | .0 | .0 | .0 | .0 | .0 | .0 |
| Account Receivables | 3,799.5 | 4,687.3 | 3,614.3 | 4,282.8 | 5,458.5 | 5,339.6 | 6,251.3 | 7,318.6 | 8,568.1 | 10,030.9 |
| Account Receivables, % | 19.98 | 22.98 | 24.04 | 31.27 | 30.92 | 25.84 | 25.84 | 25.84 | 25.84 | 25.84 |
| Inventories | 2,123.5 | 2,467.9 | 1,294.4 | 1,942.6 | 2,159.2 | 2,409.2 | 2,820.5 | 3,302.1 | 3,865.9 | 4,525.9 |
| Inventories, % | 11.17 | 12.1 | 8.61 | 14.19 | 12.23 | 11.66 | 11.66 | 11.66 | 11.66 | 11.66 |
| Accounts Payable | 5,975.1 | 6,011.4 | 4,575.9 | 5,713.1 | 6,834.7 | 7,099.0 | 8,311.0 | 9,730.0 | 11,391.2 | 13,336.0 |
| Accounts Payable, % | 31.42 | 29.47 | 30.43 | 41.72 | 38.72 | 34.35 | 34.35 | 34.35 | 34.35 | 34.35 |
| Capital Expenditure | .0 | .0 | .0 | .0 | .0 | .0 | .0 | .0 | .0 | .0 |
| Capital Expenditure, % | 0 | 0 | 0 | 0 | 0 | 0 | 0 | 0 | 0 | 0 |
| Tax Rate, % | 39.36 | 39.36 | 39.36 | 39.36 | 39.36 | 39.36 | 39.36 | 39.36 | 39.36 | 39.36 |
| EBITAT | 1,055.4 | 1,054.9 | 291.6 | 314.6 | 269.6 | 643.1 | 752.9 | 881.5 | 1,032.0 | 1,208.2 |
| Depreciation | ||||||||||
| Changes in Account Receivables | ||||||||||
| Changes in Inventories | ||||||||||
| Changes in Accounts Payable | ||||||||||
| Capital Expenditure | ||||||||||
| UFCF | 1,496.8 | 367.8 | 1,612.8 | 620.1 | 380.9 | 1,340.1 | 1,302.0 | 1,524.3 | 1,784.5 | 2,089.2 |
| WACC, % | 8.53 | 8.55 | 8.63 | 8.63 | 8.33 | 8.53 | 8.53 | 8.53 | 8.53 | 8.53 |
| PV UFCF | ||||||||||
| SUM PV UFCF | 6,205.4 | |||||||||
| Long Term Growth Rate, % | 3.50 | |||||||||
| Free cash flow (T + 1) | 2,162 | |||||||||
| Terminal Value | 42,948 | |||||||||
| Present Terminal Value | 28,516 | |||||||||
| Enterprise Value | 34,722 | |||||||||
| Net Debt | 1,090 | |||||||||
| Equity Value | 33,632 | |||||||||
| Diluted Shares Outstanding, MM | 1,185 | |||||||||
| Equity Value Per Share | 28.38 |
Benefits You Will Enjoy
- Comprehensive Financial Model: Leverage Q Technology’s real financial data for accurate DCF valuation.
- Complete Forecasting Control: Modify revenue growth, profit margins, WACC, and other essential parameters.
- Real-Time Calculations: Automatic updates provide immediate visibility of results as adjustments are made.
- Professional-Grade Template: An expertly crafted Excel file tailored for high-quality valuation presentations.
- Flexible and Reusable: Designed for adaptability, enabling repeated use for detailed financial projections.
Key Features
- Authentic Q Technology Financials: Gain access to precise historical data and forward-looking projections.
- Tailorable Forecast Inputs: Modify the highlighted cells for metrics like WACC, growth rates, and profit margins.
- Responsive Calculations: Automatic refresh of DCF, Net Present Value (NPV), and cash flow evaluations.
- Intuitive Visual Dashboard: User-friendly charts and summaries to help visualize your valuation outcomes.
- Designed for All Users: An accessible and straightforward layout suitable for investors, CFOs, and consultants alike.
How It Functions
- Download the Template: Gain immediate access to the Excel-based Q Technology (Group) Company Limited (1478HK) DCF Calculator.
- Input Your Assumptions: Modify the yellow-highlighted cells to set growth rates, WACC, margins, and other parameters.
- Instant Calculations: The model automatically refreshes to show Q Technology's intrinsic value.
- Test Scenarios: Experiment with various assumptions to assess potential changes in valuation.
- Analyze and Decide: Utilize the outcomes to inform your investment or financial analysis.
Why Opt for the Q Technology (Group) Company Limited Calculator?
- Precision: Utilize authentic financial data from Q Technology for reliable results.
- Versatility: Tailored for users to easily experiment with and adjust inputs.
- Efficiency: Avoid the complexities of constructing a DCF model from the ground up.
- High-Quality: Crafted with the expertise and usability expected at the CFO level.
- Intuitive: Simple to navigate, even for those lacking extensive financial modeling skills.
Who Can Benefit from This Product?
- Investors: Evaluate Q Technology's (1478HK) performance before making trading decisions.
- CFOs and Financial Analysts: Optimize valuation methodologies and assess financial forecasts.
- Startup Founders: Discover how leading public companies like Q Technology (1478HK) are valued in the market.
- Consultants: Create detailed valuation reports for your clients based on Q Technology (1478HK).
- Students and Educators: Utilize current data to practice and impart valuation skills effectively.
Contents of the Template
- Pre-Filled DCF Model: Q Technology’s financial information readily available for immediate application.
- WACC Calculator: Comprehensive calculations for Weighted Average Cost of Capital.
- Financial Ratios: Assess Q Technology’s profitability, leverage, and operational efficiency.
- Editable Inputs: Customize assumptions such as growth rates, margins, and CAPEX to suit your analysis.
- Financial Statements: Annual and quarterly reports to facilitate in-depth evaluation.
- Interactive Dashboard: Effortlessly visualize essential valuation metrics and outcomes.
Disclaimer
All information, articles, and product details provided on this website are for general informational and educational purposes only. We do not claim any ownership over, nor do we intend to infringe upon, any trademarks, copyrights, logos, brand names, or other intellectual property mentioned or depicted on this site. Such intellectual property remains the property of its respective owners, and any references here are made solely for identification or informational purposes, without implying any affiliation, endorsement, or partnership.
We make no representations or warranties, express or implied, regarding the accuracy, completeness, or suitability of any content or products presented. Nothing on this website should be construed as legal, tax, investment, financial, medical, or other professional advice. In addition, no part of this site—including articles or product references—constitutes a solicitation, recommendation, endorsement, advertisement, or offer to buy or sell any securities, franchises, or other financial instruments, particularly in jurisdictions where such activity would be unlawful.
All content is of a general nature and may not address the specific circumstances of any individual or entity. It is not a substitute for professional advice or services. Any actions you take based on the information provided here are strictly at your own risk. You accept full responsibility for any decisions or outcomes arising from your use of this website and agree to release us from any liability in connection with your use of, or reliance upon, the content or products found herein.