
|
Yichang HEC Changjiang Pharmaceutical Co., Ltd. (1558.HK) Valoración de DCF |
Completamente Editable: Adáptelo A Sus Necesidades En Excel O Sheets
Diseño Profesional: Plantillas Confiables Y Estándares De La Industria
Predeterminadas Para Un Uso Rápido Y Eficiente
Compatible con MAC / PC, completamente desbloqueado
No Se Necesita Experiencia; Fáciles De Seguir
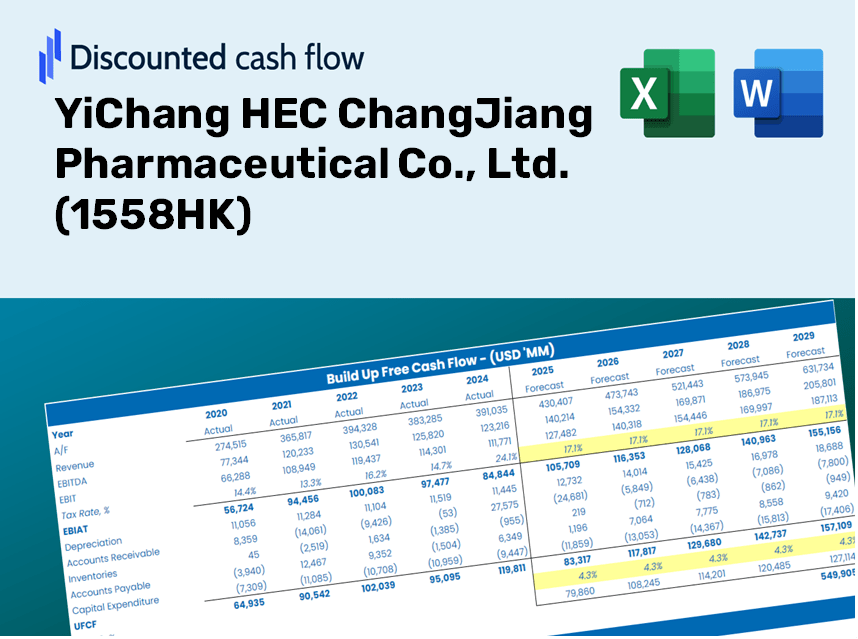
YiChang HEC ChangJiang Pharmaceutical Co., Ltd. (1558.HK) Bundle
¡Explore las perspectivas financieras de Yichang Hec Changjiang Pharmaceutical Co., Ltd. (1558HK) con nuestra calculadora DCF fácil de usar! Ingrese sus suposiciones con respecto al crecimiento, los márgenes y los costos para calcular el valor intrínseco de Yichang Hec Changjiang Pharmaceutical Co., Ltd. (1558HK) y mejorar su enfoque de inversión.
Discounted Cash Flow (DCF) - (USD MM)
| Year | AY1 2020 |
AY2 2021 |
AY3 2022 |
AY4 2023 |
AY5 2024 |
FY1 2025 |
FY2 2026 |
FY3 2027 |
FY4 2028 |
FY5 2029 |
|---|---|---|---|---|---|---|---|---|---|---|
| Revenue | 2,567.1 | 999.0 | 4,094.2 | 6,881.6 | 4,071.0 | 4,744.4 | 5,529.0 | 6,443.5 | 7,509.2 | 8,751.1 |
| Revenue Growth, % | 0 | -61.08 | 309.83 | 68.08 | -40.84 | 16.54 | 16.54 | 16.54 | 16.54 | 16.54 |
| EBITDA | 1,038.8 | -225.8 | 756.0 | 3,001.5 | 1,149.3 | 1,026.4 | 1,196.2 | 1,394.0 | 1,624.6 | 1,893.3 |
| EBITDA, % | 40.47 | -22.6 | 18.46 | 43.62 | 28.23 | 21.64 | 21.64 | 21.64 | 21.64 | 21.64 |
| Depreciation | 134.2 | 284.0 | 412.5 | 427.8 | 418.0 | 571.4 | 665.9 | 776.0 | 904.4 | 1,054.0 |
| Depreciation, % | 5.23 | 28.43 | 10.08 | 6.22 | 10.27 | 12.04 | 12.04 | 12.04 | 12.04 | 12.04 |
| EBIT | 904.7 | -509.9 | 343.4 | 2,573.7 | 731.3 | 455.0 | 530.3 | 618.0 | 720.2 | 839.4 |
| EBIT, % | 35.24 | -51.04 | 8.39 | 37.4 | 17.96 | 9.59 | 9.59 | 9.59 | 9.59 | 9.59 |
| Total Cash | 2,235.7 | 1,236.6 | 1,326.7 | 1,851.0 | 1,538.9 | 2,696.6 | 3,142.6 | 3,662.4 | 4,268.1 | 4,974.0 |
| Total Cash, percent | .0 | .0 | .0 | .0 | .0 | .0 | .0 | .0 | .0 | .0 |
| Account Receivables | 503.5 | 523.7 | 1,099.6 | 2,265.9 | 2,356.6 | 1,800.1 | 2,097.8 | 2,444.7 | 2,849.1 | 3,320.3 |
| Account Receivables, % | 19.61 | 52.42 | 26.86 | 32.93 | 57.89 | 37.94 | 37.94 | 37.94 | 37.94 | 37.94 |
| Inventories | 413.5 | 305.8 | 344.4 | 447.2 | 706.2 | 749.4 | 873.3 | 1,017.7 | 1,186.1 | 1,382.2 |
| Inventories, % | 16.11 | 30.61 | 8.41 | 6.5 | 17.35 | 15.79 | 15.79 | 15.79 | 15.79 | 15.79 |
| Accounts Payable | 261.9 | 126.1 | 183.0 | 219.2 | 193.8 | 334.4 | 389.7 | 454.1 | 529.2 | 616.7 |
| Accounts Payable, % | 10.2 | 12.62 | 4.47 | 3.19 | 4.76 | 7.05 | 7.05 | 7.05 | 7.05 | 7.05 |
| Capital Expenditure | -1,086.9 | -389.5 | -623.2 | -650.6 | -1,292.3 | -1,307.1 | -1,523.2 | -1,775.2 | -2,068.8 | -2,410.9 |
| Capital Expenditure, % | -42.34 | -38.99 | -15.22 | -9.45 | -31.74 | -27.55 | -27.55 | -27.55 | -27.55 | -27.55 |
| Tax Rate, % | 16.37 | 16.37 | 16.37 | 16.37 | 16.37 | 16.37 | 16.37 | 16.37 | 16.37 | 16.37 |
| EBITAT | 751.6 | -449.1 | 667.3 | 2,411.4 | 611.6 | 408.2 | 475.7 | 554.3 | 646.0 | 752.9 |
| Depreciation | ||||||||||
| Changes in Account Receivables | ||||||||||
| Changes in Inventories | ||||||||||
| Changes in Accounts Payable | ||||||||||
| Capital Expenditure | ||||||||||
| UFCF | -856.2 | -602.9 | -101.0 | 955.7 | -637.9 | 326.3 | -748.0 | -871.7 | -1,015.9 | -1,184.0 |
| WACC, % | 4.55 | 4.58 | 4.64 | 4.61 | 4.55 | 4.58 | 4.58 | 4.58 | 4.58 | 4.58 |
| PV UFCF | ||||||||||
| SUM PV UFCF | -2,929.3 | |||||||||
| Long Term Growth Rate, % | 4.00 | |||||||||
| Free cash flow (T + 1) | -1,231 | |||||||||
| Terminal Value | -210,617 | |||||||||
| Present Terminal Value | -168,327 | |||||||||
| Enterprise Value | -171,257 | |||||||||
| Net Debt | 909 | |||||||||
| Equity Value | -172,165 | |||||||||
| Diluted Shares Outstanding, MM | 880 | |||||||||
| Equity Value Per Share | -195.65 |
What You Will Receive
- Authentic 1558HK Financials: Access comprehensive historical and projected data for precise valuation.
- Customizable Inputs: Adjust parameters such as WACC, tax rates, revenue growth, and capital expenditures as needed.
- Automated Calculations: Automatically generate intrinsic value and NPV calculations on-the-fly.
- Scenario Analysis: Explore various scenarios to assess the future outlook of YiChang HEC ChangJiang Pharmaceutical Co., Ltd.
- User-Friendly Design: Designed for industry professionals while remaining approachable for newcomers.
Key Features
- Authentic 1558HK Data: Pre-populated with YiChang HEC ChangJiang Pharmaceutical's historical financials and future projections.
- Comprehensive Customization Options: Modify revenue growth, profit margins, WACC, tax rates, and capital expenditures to suit your analysis.
- Interactive Valuation Model: Automatic recalculations of Net Present Value (NPV) and intrinsic value in response to your inputs.
- Multi-Scenario Analysis: Develop various forecasting scenarios to evaluate different valuation results.
- User-Centric Interface: Intuitive and organized, catering to both industry experts and newcomers.
How It Works
- 1. Access the Template: Download and open the Excel file containing the preloaded data for YiChang HEC ChangJiang Pharmaceutical Co., Ltd. (1558HK).
- 2. Adjust Key Assumptions: Modify essential inputs such as growth rates, WACC, and capital expenditures according to your analysis.
- 3. Instant Results: The DCF model automatically calculates the intrinsic value and NPV based on your inputs.
- 4. Explore Different Scenarios: Analyze various forecasts to evaluate diverse valuation possibilities.
- 5. Present with Assurance: Deliver professional valuation insights to facilitate informed decision-making.
Why Choose This Calculator for YiChang HEC ChangJiang Pharmaceutical Co., Ltd. (1558HK)?
- Reliable Data: Utilize authentic financial information from YiChang HEC to ensure trustworthy valuation outcomes.
- Customizable Options: Modify essential parameters such as growth rates, WACC, and tax rates to align with your forecasts.
- Efficiency Boost: Pre-configured calculations save you time by eliminating the need to start from square one.
- Professional Quality: Tailored for investors, analysts, and consultants looking to make informed decisions.
- User-Friendly Interface: An intuitive design with straightforward instructions makes it accessible for all users.
Who Can Benefit from YiChang HEC ChangJiang Pharmaceutical Co., Ltd. (1558HK)?
- Investors: Make informed investment choices with our comprehensive analysis and insights.
- Financial Analysts: Streamline your workflow with our customizable financial models tailored for pharmaceutical companies.
- Consultants: Easily modify our templates for client reports or presentations in the healthcare sector.
- Finance Enthusiasts: Explore real-world examples to enhance your knowledge of pharmaceutical valuation methods.
- Educators and Students: Utilize our resources as a hands-on learning tool in finance and pharmaceutical courses.
Contents of the Template
- Pre-Filled Data: Features YiChang HEC ChangJiang Pharmaceutical's historical financials and forecasts.
- Discounted Cash Flow Model: An editable DCF valuation model with automated calculations.
- Weighted Average Cost of Capital (WACC): A specific worksheet for calculating WACC using custom inputs.
- Key Financial Ratios: Assess YiChang HEC's profitability, efficiency, and leverage metrics.
- Customizable Inputs: Easily modify revenue growth, profit margins, and tax rates.
- Clear Dashboard: Visuals and tables that summarize essential valuation outcomes.
Disclaimer
All information, articles, and product details provided on this website are for general informational and educational purposes only. We do not claim any ownership over, nor do we intend to infringe upon, any trademarks, copyrights, logos, brand names, or other intellectual property mentioned or depicted on this site. Such intellectual property remains the property of its respective owners, and any references here are made solely for identification or informational purposes, without implying any affiliation, endorsement, or partnership.
We make no representations or warranties, express or implied, regarding the accuracy, completeness, or suitability of any content or products presented. Nothing on this website should be construed as legal, tax, investment, financial, medical, or other professional advice. In addition, no part of this site—including articles or product references—constitutes a solicitation, recommendation, endorsement, advertisement, or offer to buy or sell any securities, franchises, or other financial instruments, particularly in jurisdictions where such activity would be unlawful.
All content is of a general nature and may not address the specific circumstances of any individual or entity. It is not a substitute for professional advice or services. Any actions you take based on the information provided here are strictly at your own risk. You accept full responsibility for any decisions or outcomes arising from your use of this website and agree to release us from any liability in connection with your use of, or reliance upon, the content or products found herein.