
|
Conserv Pharmaceutical Group Limited (1681.HK) Valoración de DCF |
Completamente Editable: Adáptelo A Sus Necesidades En Excel O Sheets
Diseño Profesional: Plantillas Confiables Y Estándares De La Industria
Predeterminadas Para Un Uso Rápido Y Eficiente
Compatible con MAC / PC, completamente desbloqueado
No Se Necesita Experiencia; Fáciles De Seguir
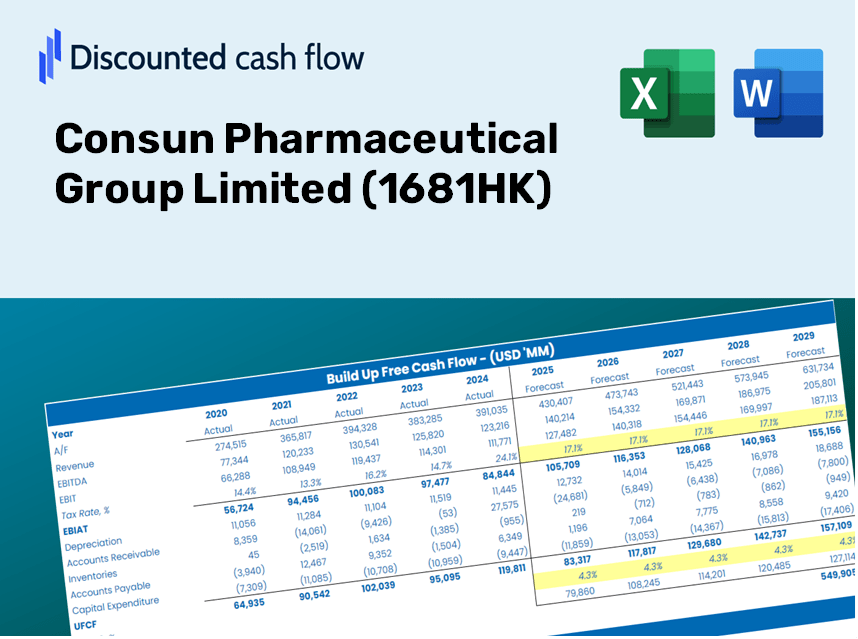
Consun Pharmaceutical Group Limited (1681.HK) Bundle
Ya sea que sea un inversor o un analista, esta calculadora DCF (1681HK) es su herramienta definitiva para una valoración precisa. Precedidos con datos reales del grupo farmacéutico de consumo limitado, puede ajustar los pronósticos y observar instantáneamente los efectos.
Discounted Cash Flow (DCF) - (USD MM)
| Year | AY1 2020 |
AY2 2021 |
AY3 2022 |
AY4 2023 |
AY5 2024 |
FY1 2025 |
FY2 2026 |
FY3 2027 |
FY4 2028 |
FY5 2029 |
|---|---|---|---|---|---|---|---|---|---|---|
| Revenue | 1,916.5 | 2,235.6 | 2,558.2 | 2,832.0 | 3,244.4 | 3,701.4 | 4,222.7 | 4,817.5 | 5,496.0 | 6,270.2 |
| Revenue Growth, % | 0 | 16.65 | 14.43 | 10.71 | 14.56 | 14.09 | 14.09 | 14.09 | 14.09 | 14.09 |
| EBITDA | 676.6 | 796.8 | 859.3 | 1,053.0 | 1,144.3 | 1,310.2 | 1,494.7 | 1,705.2 | 1,945.4 | 2,219.5 |
| EBITDA, % | 35.3 | 35.64 | 33.59 | 37.18 | 35.27 | 35.4 | 35.4 | 35.4 | 35.4 | 35.4 |
| Depreciation | 75.1 | 74.9 | 77.1 | 85.4 | 78.3 | 116.3 | 132.7 | 151.4 | 172.7 | 197.0 |
| Depreciation, % | 3.92 | 3.35 | 3.01 | 3.01 | 2.41 | 3.14 | 3.14 | 3.14 | 3.14 | 3.14 |
| EBIT | 601.5 | 721.8 | 782.2 | 967.6 | 1,066.0 | 1,193.9 | 1,362.0 | 1,553.9 | 1,772.8 | 2,022.5 |
| EBIT, % | 31.39 | 32.29 | 30.58 | 34.17 | 32.86 | 32.26 | 32.26 | 32.26 | 32.26 | 32.26 |
| Total Cash | 2,121.5 | 2,652.9 | 3,323.2 | 3,917.9 | 4,226.7 | 3,701.4 | 4,222.7 | 4,817.5 | 5,496.0 | 6,270.2 |
| Total Cash, percent | .0 | .0 | .0 | .0 | .0 | .0 | .0 | .0 | .0 | .0 |
| Account Receivables | 490.4 | 384.0 | 283.8 | 279.7 | 325.4 | 546.1 | 623.0 | 710.7 | 810.9 | 925.1 |
| Account Receivables, % | 25.59 | 17.18 | 11.09 | 9.88 | 10.03 | 14.75 | 14.75 | 14.75 | 14.75 | 14.75 |
| Inventories | 248.6 | 281.7 | 314.5 | 401.4 | 316.7 | 457.5 | 521.9 | 595.5 | 679.3 | 775.0 |
| Inventories, % | 12.97 | 12.6 | 12.3 | 14.17 | 9.76 | 12.36 | 12.36 | 12.36 | 12.36 | 12.36 |
| Accounts Payable | 55.6 | 72.9 | 65.5 | 90.9 | 82.7 | 107.2 | 122.3 | 139.5 | 159.2 | 181.6 |
| Accounts Payable, % | 2.9 | 3.26 | 2.56 | 3.21 | 2.55 | 2.9 | 2.9 | 2.9 | 2.9 | 2.9 |
| Capital Expenditure | -53.3 | -107.4 | -56.4 | -57.5 | -119.2 | -114.7 | -130.8 | -149.3 | -170.3 | -194.3 |
| Capital Expenditure, % | -2.78 | -4.81 | -2.2 | -2.03 | -3.67 | -3.1 | -3.1 | -3.1 | -3.1 | -3.1 |
| Tax Rate, % | 10.75 | 10.75 | 10.75 | 10.75 | 10.75 | 10.75 | 10.75 | 10.75 | 10.75 | 10.75 |
| EBITAT | 514.0 | 612.2 | 715.7 | 878.9 | 951.5 | 1,055.0 | 1,203.6 | 1,373.1 | 1,566.6 | 1,787.2 |
| Depreciation | ||||||||||
| Changes in Account Receivables | ||||||||||
| Changes in Inventories | ||||||||||
| Changes in Accounts Payable | ||||||||||
| Capital Expenditure | ||||||||||
| UFCF | -147.6 | 670.3 | 796.3 | 849.4 | 941.4 | 719.6 | 1,079.2 | 1,231.2 | 1,404.6 | 1,602.4 |
| WACC, % | 5.91 | 5.9 | 5.92 | 5.92 | 5.91 | 5.91 | 5.91 | 5.91 | 5.91 | 5.91 |
| PV UFCF | ||||||||||
| SUM PV UFCF | 4,996.5 | |||||||||
| Long Term Growth Rate, % | 0.50 | |||||||||
| Free cash flow (T + 1) | 1,610 | |||||||||
| Terminal Value | 29,758 | |||||||||
| Present Terminal Value | 22,330 | |||||||||
| Enterprise Value | 27,326 | |||||||||
| Net Debt | -2,887 | |||||||||
| Equity Value | 30,214 | |||||||||
| Diluted Shares Outstanding, MM | 832 | |||||||||
| Equity Value Per Share | 36.31 |
What You Will Receive
- Customizable Excel Template: An adaptable Excel-based DCF Calculator featuring pre-filled financial data for Consun Pharmaceutical Group Limited (1681HK).
- Actual Market Data: Historical figures and projections (displayed in the highlighted cells).
- Adjustable Forecasts: Modify assumptions such as revenue growth, EBITDA %, and WACC to suit your analysis.
- Instant Calculations: Quickly observe how your inputs influence the valuation of Consun Pharmaceutical Group Limited (1681HK).
- Expert Tool: Designed for investors, CFOs, advisors, and financial analysts.
- Intuitive Interface: Organized for simplicity and effectiveness, complete with step-by-step guidance.
Key Features
- Comprehensive DCF Calculator: Features detailed unlevered and levered DCF valuation models tailored for Consun Pharmaceutical Group Limited (1681HK).
- WACC Calculator: A pre-built Weighted Average Cost of Capital sheet with flexible input options specific to 1681HK.
- Customizable Forecast Assumptions: Adjust growth rates, capital expenditures, and discount rates according to your analysis needs.
- Integrated Financial Ratios: Evaluate profitability, leverage, and efficiency ratios for Consun Pharmaceutical Group Limited (1681HK).
- Interactive Dashboard and Charts: Visual representations summarize essential valuation metrics for straightforward analysis.
How It Functions
- Download: Obtain the pre-built Excel file containing Consun Pharmaceutical Group Limited’s (1681HK) financial data.
- Customize: Modify projections, including revenue growth, EBITDA %, and WACC.
- Update Automatically: Intrinsic value and NPV calculations refresh in real-time.
- Test Scenarios: Generate various projections and compare results immediately.
- Make Decisions: Utilize the valuation outcomes to inform your investment strategy.
Why Opt for This Calculator for Consun Pharmaceutical Group Limited (1681HK)?
- Precision: Utilizes accurate financial data from Consun for reliable results.
- Versatility: Allows users to experiment and adjust inputs easily.
- Efficiency: Eliminate the time-consuming process of creating a DCF model from the ground up.
- Expert-Quality: Crafted with the attention to detail and usability expected at the CFO level.
- Intuitive: Simple to navigate, even for individuals without extensive financial modeling skills.
Who Should Use This Product?
- Individual Investors: Gain insights to make informed decisions regarding buying or selling Consun Pharmaceutical Group Limited (1681HK) stock.
- Financial Analysts: Enhance valuation workflows utilizing ready-to-implement financial models specific to Consun Pharmaceutical Group Limited (1681HK).
- Consultants: Provide clients with precise and timely valuation analyses related to Consun Pharmaceutical Group Limited (1681HK).
- Business Owners: Learn how large pharmaceutical companies like Consun Pharmaceutical Group Limited (1681HK) are valued to inform your business strategy.
- Finance Students: Master valuation methods through the exploration of real-world scenarios and data involving Consun Pharmaceutical Group Limited (1681HK).
Contents of the Template
- Operating and Balance Sheet Data: Pre-filled historical data and forecasts for Consun Pharmaceutical Group Limited (1681HK), including revenue, EBITDA, EBIT, and capital expenditures.
- WACC Calculation: A dedicated sheet for calculating the Weighted Average Cost of Capital (WACC), featuring parameters such as Beta, risk-free rate, and share price.
- DCF Valuation (Unlevered and Levered): Customizable Discounted Cash Flow models that provide intrinsic value calculations with comprehensive details.
- Financial Statements: Pre-loaded annual and quarterly financial statements to aid in analysis.
- Key Ratios: A collection of profitability, leverage, and efficiency ratios specifically for Consun Pharmaceutical Group Limited (1681HK).
- Dashboard and Charts: A visual overview of valuation outputs and assumptions to facilitate easy result analysis.
Disclaimer
All information, articles, and product details provided on this website are for general informational and educational purposes only. We do not claim any ownership over, nor do we intend to infringe upon, any trademarks, copyrights, logos, brand names, or other intellectual property mentioned or depicted on this site. Such intellectual property remains the property of its respective owners, and any references here are made solely for identification or informational purposes, without implying any affiliation, endorsement, or partnership.
We make no representations or warranties, express or implied, regarding the accuracy, completeness, or suitability of any content or products presented. Nothing on this website should be construed as legal, tax, investment, financial, medical, or other professional advice. In addition, no part of this site—including articles or product references—constitutes a solicitation, recommendation, endorsement, advertisement, or offer to buy or sell any securities, franchises, or other financial instruments, particularly in jurisdictions where such activity would be unlawful.
All content is of a general nature and may not address the specific circumstances of any individual or entity. It is not a substitute for professional advice or services. Any actions you take based on the information provided here are strictly at your own risk. You accept full responsibility for any decisions or outcomes arising from your use of this website and agree to release us from any liability in connection with your use of, or reliance upon, the content or products found herein.