
|
Shanghai Junshi Biosciences Co., Ltd. (1877.HK) Valoración de DCF |
Completamente Editable: Adáptelo A Sus Necesidades En Excel O Sheets
Diseño Profesional: Plantillas Confiables Y Estándares De La Industria
Predeterminadas Para Un Uso Rápido Y Eficiente
Compatible con MAC / PC, completamente desbloqueado
No Se Necesita Experiencia; Fáciles De Seguir
Shanghai Junshi Biosciences Co., Ltd. (1877.HK) Bundle
¿Busca determinar el valor intrínseco de Shanghai Junshi Biosciences Co., Ltd.? Nuestra calculadora DCF (1877HK) integra datos del mundo real con extensas características de personalización, lo que le permite ajustar preventos y mejorar sus estrategias de inversión.
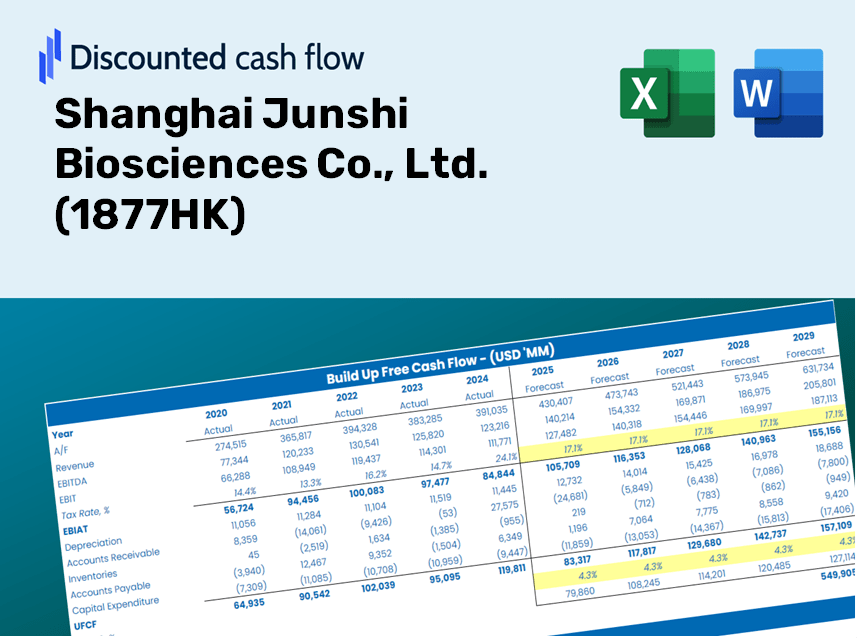
Discounted Cash Flow (DCF) - (USD MM)
| Year | AY1 2020 |
AY2 2021 |
AY3 2022 |
AY4 2023 |
AY5 2024 |
FY1 2025 |
FY2 2026 |
FY3 2027 |
FY4 2028 |
FY5 2029 |
|---|---|---|---|---|---|---|---|---|---|---|
| Revenue | 1,747.8 | 4,410.8 | 1,592.9 | 1,646.6 | 2,135.1 | 2,504.3 | 2,937.2 | 3,445.1 | 4,040.7 | 4,739.3 |
| Revenue Growth, % | 0 | 152.36 | -63.89 | 3.38 | 29.67 | 17.29 | 17.29 | 17.29 | 17.29 | 17.29 |
| EBITDA | -1,726.8 | -522.0 | -2,762.1 | -2,364.6 | -1,025.2 | -1,796.3 | -2,106.9 | -2,471.1 | -2,898.4 | -3,399.5 |
| EBITDA, % | -98.8 | -11.83 | -173.4 | -143.6 | -48.02 | -71.73 | -71.73 | -71.73 | -71.73 | -71.73 |
| Depreciation | 130.8 | 229.9 | 265.8 | 332.3 | 303.1 | 319.3 | 374.5 | 439.3 | 515.2 | 604.3 |
| Depreciation, % | 7.48 | 5.21 | 16.69 | 20.18 | 14.2 | 12.75 | 12.75 | 12.75 | 12.75 | 12.75 |
| EBIT | -1,857.6 | -751.8 | -3,027.9 | -2,696.9 | -1,328.3 | -1,899.5 | -2,227.9 | -2,613.1 | -3,064.9 | -3,594.8 |
| EBIT, % | -106.28 | -17.05 | -190.09 | -163.78 | -62.21 | -75.85 | -75.85 | -75.85 | -75.85 | -75.85 |
| Total Cash | 3,709.6 | 3,840.7 | 6,572.0 | 4,140.4 | 3,213.9 | 2,439.5 | 2,861.3 | 3,356.0 | 3,936.2 | 4,616.8 |
| Total Cash, percent | .0 | .0 | .0 | .0 | .0 | .0 | .0 | .0 | .0 | .0 |
| Account Receivables | 726.9 | 1,421.7 | 283.7 | 529.6 | 558.7 | 751.1 | 881.0 | 1,033.3 | 1,211.9 | 1,421.4 |
| Account Receivables, % | 41.59 | 32.23 | 17.81 | 32.16 | 26.17 | 29.99 | 29.99 | 29.99 | 29.99 | 29.99 |
| Inventories | 376.4 | 531.1 | 656.5 | 589.6 | 640.5 | 704.2 | 825.9 | 968.7 | 1,136.2 | 1,332.6 |
| Inventories, % | 21.53 | 12.04 | 41.21 | 35.81 | 30 | 28.12 | 28.12 | 28.12 | 28.12 | 28.12 |
| Accounts Payable | 99.4 | 215.0 | 308.6 | 271.0 | 228.3 | 285.9 | 335.4 | 393.3 | 461.3 | 541.1 |
| Accounts Payable, % | 5.69 | 4.87 | 19.37 | 16.46 | 10.69 | 11.42 | 11.42 | 11.42 | 11.42 | 11.42 |
| Capital Expenditure | -649.5 | -971.2 | -431.7 | -912.4 | -757.2 | -887.3 | -1,040.7 | -1,220.7 | -1,431.7 | -1,679.2 |
| Capital Expenditure, % | -37.16 | -22.02 | -27.1 | -55.41 | -35.47 | -35.43 | -35.43 | -35.43 | -35.43 | -35.43 |
| Tax Rate, % | 5.64 | 5.64 | 5.64 | 5.64 | 5.64 | 5.64 | 5.64 | 5.64 | 5.64 | 5.64 |
| EBITAT | -1,853.3 | -911.6 | -2,700.6 | -2,471.3 | -1,253.3 | -1,804.4 | -2,116.3 | -2,482.2 | -2,911.4 | -3,414.7 |
| Depreciation | ||||||||||
| Changes in Account Receivables | ||||||||||
| Changes in Inventories | ||||||||||
| Changes in Accounts Payable | ||||||||||
| Capital Expenditure | ||||||||||
| UFCF | -3,376.0 | -2,386.8 | -1,760.4 | -3,268.0 | -1,830.1 | -2,570.9 | -2,984.7 | -3,500.7 | -4,106.0 | -4,815.8 |
| WACC, % | 7.54 | 7.54 | 7.5 | 7.51 | 7.52 | 7.52 | 7.52 | 7.52 | 7.52 | 7.52 |
| PV UFCF | ||||||||||
| SUM PV UFCF | -14,212.2 | |||||||||
| Long Term Growth Rate, % | 2.00 | |||||||||
| Free cash flow (T + 1) | -4,912 | |||||||||
| Terminal Value | -88,961 | |||||||||
| Present Terminal Value | -61,904 | |||||||||
| Enterprise Value | -76,117 | |||||||||
| Net Debt | 470 | |||||||||
| Equity Value | -76,586 | |||||||||
| Diluted Shares Outstanding, MM | 985 | |||||||||
| Equity Value Per Share | -77.73 |
What You Will Receive
- Pre-Filled Financial Model: Utilizes Shanghai Junshi Biosciences' actual data for accurate DCF valuation.
- Comprehensive Forecast Control: Modify revenue growth, profit margins, WACC, and other essential drivers.
- Real-Time Calculations: Instant updates provide immediate visibility of results as you adjust parameters.
- Investor-Ready Template: A polished Excel file crafted for professional-level valuation.
- Customizable and Reusable: Designed for adaptability, allowing for repeated application in detailed forecasting.
Core Features
- Customizable Forecast Inputs: Adjust essential parameters such as revenue growth, EBITDA percentage, and capital expenditures.
- Instant DCF Valuation: Provides immediate calculations of intrinsic value, net present value (NPV), and additional outputs.
- High-Precision Accuracy: Leverages Shanghai Junshi Biosciences Co., Ltd.'s ([1877HK]) actual financial data for realistic valuation results.
- Effortless Scenario Analysis: Easily explore various assumptions and compare different outcomes.
- Efficiency Booster: Remove the need to create intricate valuation models from the ground up.
How It Functions
- Download: Obtain the pre-prepared Excel file containing Shanghai Junshi Biosciences Co., Ltd.'s financial data.
- Customize: Modify projections, such as revenue growth, EBITDA %, and WACC.
- Update Automatically: Real-time updates for intrinsic value and NPV calculations.
- Test Scenarios: Generate various forecasts and quickly compare the results.
- Make Decisions: Utilize the valuation results to refine your investment approach.
Why Opt for This Calculator?
- Designed for Experts: A sophisticated tool utilized by analysts, CFOs, and consultants in the biotech sector.
- Accurate Data: Historical and projected financials of Shanghai Junshi Biosciences Co., Ltd. (1877HK) preloaded for precision.
- Flexible Scenario Analysis: Effortlessly simulate various forecasts and assumptions.
- Comprehensive Outputs: Instantly computes intrinsic value, NPV, and essential metrics.
- User-Friendly: Step-by-step guidance ensures a smooth navigation through the process.
Who Should Use This Product?
- Investors: Effectively assess the fair value of Shanghai Junshi Biosciences Co., Ltd. (1877HK) to inform investment choices.
- CFOs: Utilize a high-quality DCF model for accurate financial reporting and strategic analysis.
- Consultants: Effortlessly modify the template for client valuation reports related to (1877HK).
- Entrepreneurs: Discover financial modeling techniques employed by leading biotech firms.
- Educators: Implement it as a resource for illustrating valuation methods in the classroom.
Contents of the Template
- Historical Data: Compiles past financial results and baseline forecasts for Shanghai Junshi Biosciences Co., Ltd. (1877HK).
- DCF and Levered DCF Models: Comprehensive templates designed to assess the intrinsic value of Shanghai Junshi Biosciences Co., Ltd. (1877HK).
- WACC Sheet: Pre-formulated calculations for the Weighted Average Cost of Capital.
- Editable Inputs: Adjust key parameters such as growth rates, EBITDA percentages, and CAPEX projections.
- Quarterly and Annual Statements: An exhaustive analysis of Shanghai Junshi Biosciences Co., Ltd. (1877HK) financials.
- Interactive Dashboard: Dynamically visualize valuation outcomes and forecasts.
Disclaimer
All information, articles, and product details provided on this website are for general informational and educational purposes only. We do not claim any ownership over, nor do we intend to infringe upon, any trademarks, copyrights, logos, brand names, or other intellectual property mentioned or depicted on this site. Such intellectual property remains the property of its respective owners, and any references here are made solely for identification or informational purposes, without implying any affiliation, endorsement, or partnership.
We make no representations or warranties, express or implied, regarding the accuracy, completeness, or suitability of any content or products presented. Nothing on this website should be construed as legal, tax, investment, financial, medical, or other professional advice. In addition, no part of this site—including articles or product references—constitutes a solicitation, recommendation, endorsement, advertisement, or offer to buy or sell any securities, franchises, or other financial instruments, particularly in jurisdictions where such activity would be unlawful.
All content is of a general nature and may not address the specific circumstances of any individual or entity. It is not a substitute for professional advice or services. Any actions you take based on the information provided here are strictly at your own risk. You accept full responsibility for any decisions or outcomes arising from your use of this website and agree to release us from any liability in connection with your use of, or reliance upon, the content or products found herein.