
|
C&D International Investment Group Limited (1908.HK) Valoración de DCF |
Completamente Editable: Adáptelo A Sus Necesidades En Excel O Sheets
Diseño Profesional: Plantillas Confiables Y Estándares De La Industria
Predeterminadas Para Un Uso Rápido Y Eficiente
Compatible con MAC / PC, completamente desbloqueado
No Se Necesita Experiencia; Fáciles De Seguir
C&D International Investment Group Limited (1908.HK) Bundle
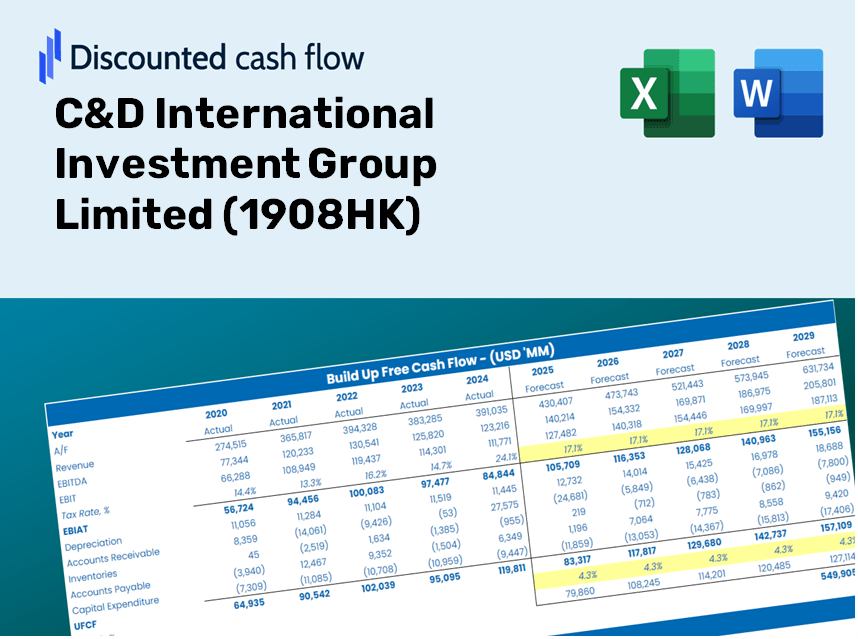
¡Evalúe las perspectivas financieras de C&D International Investment Group Limited como un experto! Esta calculadora DCF (1908HK) proporciona datos financieros previamente llenos y ofrece una flexibilidad completa para modificar el crecimiento de los ingresos, WACC, los márgenes y otros supuestos cruciales para alinearse con sus pronósticos.
Discounted Cash Flow (DCF) - (USD MM)
| Year | AY1 2020 |
AY2 2021 |
AY3 2022 |
AY4 2023 |
AY5 2024 |
FY1 2025 |
FY2 2026 |
FY3 2027 |
FY4 2028 |
FY5 2029 |
|---|---|---|---|---|---|---|---|---|---|---|
| Revenue | 46,713.7 | 59,631.8 | 108,887.7 | 146,913.2 | 156,264.0 | 215,464.8 | 297,093.8 | 409,648.1 | 564,843.6 | 778,835.1 |
| Revenue Growth, % | 0 | 27.65 | 82.6 | 34.92 | 6.36 | 37.89 | 37.89 | 37.89 | 37.89 | 37.89 |
| EBITDA | 6,218.5 | 7,150.4 | 10,278.6 | 9,967.0 | 11,198.7 | 20,983.4 | 28,933.0 | 39,894.3 | 55,008.2 | 75,848.1 |
| EBITDA, % | 13.31 | 11.99 | 9.44 | 6.78 | 7.17 | 9.74 | 9.74 | 9.74 | 9.74 | 9.74 |
| Depreciation | 78.1 | 83.5 | 130.1 | 164.9 | 65.2 | 250.3 | 345.1 | 475.8 | 656.0 | 904.6 |
| Depreciation, % | 0.16727 | 0.13999 | 0.11948 | 0.11223 | 0.04175575 | 0.11615 | 0.11615 | 0.11615 | 0.11615 | 0.11615 |
| EBIT | 6,140.4 | 7,066.9 | 10,148.5 | 9,802.1 | 11,133.4 | 20,733.1 | 28,587.9 | 39,418.5 | 54,352.2 | 74,943.5 |
| EBIT, % | 13.14 | 11.85 | 9.32 | 6.67 | 7.12 | 9.62 | 9.62 | 9.62 | 9.62 | 9.62 |
| Total Cash | 29,937.5 | 49,033.4 | 51,771.9 | 55,867.6 | 68,261.0 | 118,751.7 | 163,740.9 | 225,774.3 | 311,309.0 | 429,248.7 |
| Total Cash, percent | .0 | .0 | .0 | .0 | .0 | .0 | .0 | .0 | .0 | .0 |
| Account Receivables | 483.1 | 1,726.2 | 41,283.5 | 49,845.7 | 3,878.1 | 33,721.6 | 46,497.1 | 64,112.5 | 88,401.6 | 121,892.7 |
| Account Receivables, % | 1.03 | 2.89 | 37.91 | 33.93 | 2.48 | 15.65 | 15.65 | 15.65 | 15.65 | 15.65 |
| Inventories | 129,921.5 | 251,354.2 | 280,525.0 | 294,340.8 | 269,969.3 | 215,464.8 | 297,093.8 | 409,648.1 | 564,843.6 | 778,835.1 |
| Inventories, % | 278.12 | 421.51 | 257.63 | 200.35 | 172.76 | 100 | 100 | 100 | 100 | 100 |
| Accounts Payable | 18,108.2 | 23,390.3 | 20,294.7 | 29,344.7 | 28,252.1 | 58,037.9 | 80,025.7 | 110,343.4 | 152,147.2 | 209,788.2 |
| Accounts Payable, % | 38.76 | 39.22 | 18.64 | 19.97 | 18.08 | 26.94 | 26.94 | 26.94 | 26.94 | 26.94 |
| Capital Expenditure | -70.4 | -98.6 | -123.9 | -210.0 | -242.5 | -313.7 | -432.6 | -596.4 | -822.4 | -1,133.9 |
| Capital Expenditure, % | -0.15079 | -0.1653 | -0.11377 | -0.14294 | -0.15518 | -0.14559 | -0.14559 | -0.14559 | -0.14559 | -0.14559 |
| Tax Rate, % | 55.84 | 55.84 | 55.84 | 55.84 | 55.84 | 55.84 | 55.84 | 55.84 | 55.84 | 55.84 |
| EBITAT | 2,872.5 | 4,288.4 | 5,901.2 | 5,750.0 | 4,916.5 | 11,130.9 | 15,347.8 | 21,162.3 | 29,179.7 | 40,234.4 |
| Depreciation | ||||||||||
| Changes in Account Receivables | ||||||||||
| Changes in Inventories | ||||||||||
| Changes in Accounts Payable | ||||||||||
| Capital Expenditure | ||||||||||
| UFCF | -109,416.2 | -113,120.3 | -65,916.3 | -7,623.1 | 73,985.7 | 65,514.3 | -57,156.5 | -78,810.3 | -108,667.6 | -149,836.4 |
| WACC, % | 2.63 | 3.01 | 2.94 | 2.96 | 2.56 | 2.82 | 2.82 | 2.82 | 2.82 | 2.82 |
| PV UFCF | ||||||||||
| SUM PV UFCF | -290,436.1 | |||||||||
| Long Term Growth Rate, % | 2.00 | |||||||||
| Free cash flow (T + 1) | -152,833 | |||||||||
| Terminal Value | -18,592,008 | |||||||||
| Present Terminal Value | -16,176,900 | |||||||||
| Enterprise Value | -16,467,336 | |||||||||
| Net Debt | 29,921 | |||||||||
| Equity Value | -16,497,257 | |||||||||
| Diluted Shares Outstanding, MM | 1,932 | |||||||||
| Equity Value Per Share | -8,537.24 |
What You Will Receive
- Authentic C&D International Data: Preloaded financials – including revenue and EBIT – derived from both actual and forecasted figures.
- Comprehensive Customization: Modify all essential parameters (highlighted cells) such as WACC, growth rates, and tax percentages.
- Instant Valuation Adjustments: Automatic recalculations allow you to assess the effect of changes on the fair value of C&D International Investment Group Limited (1908HK).
- Flexible Excel Template: Designed for quick modifications, scenario analysis, and in-depth projections.
- Efficient and Precise: Eliminate the need to create models from the ground up while ensuring accuracy and adaptability.
Key Features
- Comprehensive DCF Calculator: Offers in-depth unlevered and levered DCF valuation models tailored for C&D International Investment Group Limited (1908HK).
- WACC Tool: Features a pre-configured Weighted Average Cost of Capital sheet with adjustable parameters.
- Customizable Forecast Inputs: Easily adjust growth projections, capital expenditures, and discount rates.
- Integrated Financial Ratios: Evaluate profitability, leverage, and efficiency ratios specifically for C&D International Investment Group Limited (1908HK).
- User-Friendly Dashboard and Visuals: Graphical representations provide a clear overview of essential valuation metrics for straightforward analysis.
How It Works
- 1. Download the Template: Obtain and open the Excel file featuring C&D International Investment Group Limited (1908HK)’s preloaded data.
- 2. Customize Assumptions: Adjust key variables such as growth rates, WACC, and capital expenditures.
- 3. See Immediate Results: The DCF model automatically calculates the intrinsic value and NPV.
- 4. Experiment with Scenarios: Analyze various forecasts to evaluate different valuation results.
- 5. Present with Assurance: Share professional valuation insights to inform your investment decisions.
Why Opt for This Calculator?
- Designed for Experts: A sophisticated tool utilized by analysts, CFOs, and consultants in the industry.
- Accurate Data: C&D International Investment Group Limited’s (1908HK) historical and projected financials are preloaded for precision.
- Versatile Scenario Analysis: Effortlessly test various forecasts and assumptions.
- Insightful Outputs: Automatically computes intrinsic value, NPV, and essential metrics.
- User-Friendly: Comprehensive step-by-step instructions simplify the process.
Who Should Utilize This Service?
- Institutional Investors: Develop comprehensive and reliable valuation models for portfolio assessments for C&D International Investment Group Limited (1908HK).
- Corporate Strategy Teams: Evaluate valuation scenarios to inform company strategy and decision-making.
- Investment Consultants: Deliver precise valuation insights to clients focusing on C&D International Investment Group Limited (1908HK).
- Students and Instructors: Employ real-world data for practical learning and teaching of financial modeling techniques.
- Market Analysts: Gain insights into how companies like C&D International Investment Group Limited (1908HK) are appraised in the industry.
Contents of the Template
- Pre-Filled DCF Model: C&D International Investment Group Limited’s financial data preloaded for immediate use.
- WACC Calculator: Comprehensive calculations for Weighted Average Cost of Capital.
- Financial Ratios: Analyze C&D International Investment Group Limited's profitability, leverage, and efficiency.
- Editable Inputs: Modify assumptions like growth rates, profit margins, and CAPEX to tailor your scenarios.
- Financial Statements: Access annual and quarterly reports to facilitate in-depth analysis.
- Interactive Dashboard: Effortlessly visualize essential valuation metrics and outcomes.
Disclaimer
All information, articles, and product details provided on this website are for general informational and educational purposes only. We do not claim any ownership over, nor do we intend to infringe upon, any trademarks, copyrights, logos, brand names, or other intellectual property mentioned or depicted on this site. Such intellectual property remains the property of its respective owners, and any references here are made solely for identification or informational purposes, without implying any affiliation, endorsement, or partnership.
We make no representations or warranties, express or implied, regarding the accuracy, completeness, or suitability of any content or products presented. Nothing on this website should be construed as legal, tax, investment, financial, medical, or other professional advice. In addition, no part of this site—including articles or product references—constitutes a solicitation, recommendation, endorsement, advertisement, or offer to buy or sell any securities, franchises, or other financial instruments, particularly in jurisdictions where such activity would be unlawful.
All content is of a general nature and may not address the specific circumstances of any individual or entity. It is not a substitute for professional advice or services. Any actions you take based on the information provided here are strictly at your own risk. You accept full responsibility for any decisions or outcomes arising from your use of this website and agree to release us from any liability in connection with your use of, or reliance upon, the content or products found herein.