
|
Exeo Group, Inc. (1951.T) Valoración de DCF |
Completamente Editable: Adáptelo A Sus Necesidades En Excel O Sheets
Diseño Profesional: Plantillas Confiables Y Estándares De La Industria
Predeterminadas Para Un Uso Rápido Y Eficiente
Compatible con MAC / PC, completamente desbloqueado
No Se Necesita Experiencia; Fáciles De Seguir
EXEO Group, Inc. (1951.T) Bundle
¡Obtenga información sobre su análisis de valoración Exeo Group, Inc. (1951T) utilizando nuestra sofisticada calculadora DCF! Prelabastado con datos auténticos (1951T), esta plantilla de Excel le permite ajustar los pronósticos y supuestos para determinar con precisión el valor intrínseco de Exeo Group, Inc.
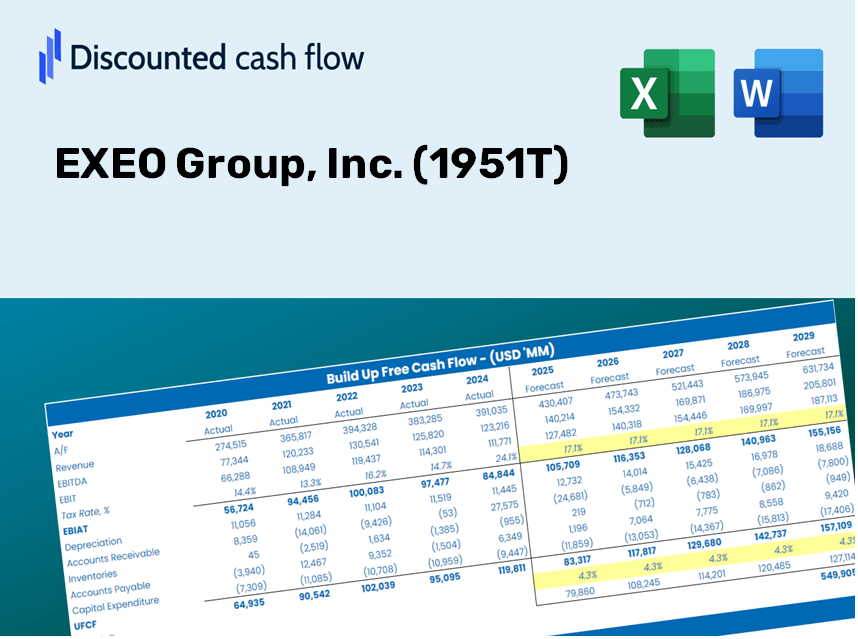
Discounted Cash Flow (DCF) - (USD MM)
| Year | AY1 2020 |
AY2 2021 |
AY3 2022 |
AY4 2023 |
AY5 2024 |
FY1 2025 |
FY2 2026 |
FY3 2027 |
FY4 2028 |
FY5 2029 |
|---|---|---|---|---|---|---|---|---|---|---|
| Revenue | 573,339.0 | 594,840.0 | 627,607.0 | 614,095.0 | 670,822.0 | 698,230.5 | 726,758.9 | 756,452.8 | 787,360.1 | 819,530.1 |
| Revenue Growth, % | 0 | 3.75 | 5.51 | -2.15 | 9.24 | 4.09 | 4.09 | 4.09 | 4.09 | 4.09 |
| EBITDA | 47,466.0 | 51,750.0 | 50,366.0 | 50,458.0 | 59,574.0 | 58,792.6 | 61,194.8 | 63,695.1 | 66,297.6 | 69,006.3 |
| EBITDA, % | 8.28 | 8.7 | 8.03 | 8.22 | 8.88 | 8.42 | 8.42 | 8.42 | 8.42 | 8.42 |
| Depreciation | 8,653.0 | 9,369.0 | 12,296.0 | 13,485.0 | 14,514.0 | 13,130.9 | 13,667.4 | 14,225.8 | 14,807.1 | 15,412.1 |
| Depreciation, % | 1.51 | 1.58 | 1.96 | 2.2 | 2.16 | 1.88 | 1.88 | 1.88 | 1.88 | 1.88 |
| EBIT | 38,813.0 | 42,381.0 | 38,070.0 | 36,973.0 | 45,060.0 | 45,661.7 | 47,527.4 | 49,469.3 | 51,490.5 | 53,594.3 |
| EBIT, % | 6.77 | 7.12 | 6.07 | 6.02 | 6.72 | 6.54 | 6.54 | 6.54 | 6.54 | 6.54 |
| Total Cash | 43,695.0 | 55,610.0 | 51,716.0 | 48,249.0 | 40,010.0 | 54,505.7 | 56,732.7 | 59,050.7 | 61,463.4 | 63,974.7 |
| Total Cash, percent | .0 | .0 | .0 | .0 | .0 | .0 | .0 | .0 | .0 | .0 |
| Account Receivables | 204,577.0 | 217,576.0 | 232,484.0 | 235,538.0 | 279,074.0 | 264,292.7 | 275,091.2 | 286,330.9 | 298,029.9 | 310,206.8 |
| Account Receivables, % | 35.68 | 36.58 | 37.04 | 38.36 | 41.6 | 37.85 | 37.85 | 37.85 | 37.85 | 37.85 |
| Inventories | 43,564.0 | 46,194.0 | 53,877.0 | 53,421.0 | 57,717.0 | 57,606.3 | 59,960.0 | 62,409.9 | 64,959.8 | 67,614.0 |
| Inventories, % | 7.6 | 7.77 | 8.58 | 8.7 | 8.6 | 8.25 | 8.25 | 8.25 | 8.25 | 8.25 |
| Accounts Payable | 74,890.0 | 69,579.0 | 75,033.0 | 73,414.0 | 83,031.0 | 85,249.6 | 88,732.8 | 92,358.2 | 96,131.8 | 100,059.6 |
| Accounts Payable, % | 13.06 | 11.7 | 11.96 | 11.95 | 12.38 | 12.21 | 12.21 | 12.21 | 12.21 | 12.21 |
| Capital Expenditure | -10,162.0 | -20,171.0 | -13,737.0 | -19,769.0 | -15,761.0 | -18,043.6 | -18,780.8 | -19,548.1 | -20,346.8 | -21,178.2 |
| Capital Expenditure, % | -1.77 | -3.39 | -2.19 | -3.22 | -2.35 | -2.58 | -2.58 | -2.58 | -2.58 | -2.58 |
| Tax Rate, % | 38.98 | 38.98 | 38.98 | 38.98 | 38.98 | 38.98 | 38.98 | 38.98 | 38.98 | 38.98 |
| EBITAT | 24,284.6 | 26,676.4 | 22,613.2 | 20,499.9 | 27,495.7 | 27,522.8 | 28,647.3 | 29,817.8 | 31,036.1 | 32,304.2 |
| Depreciation | ||||||||||
| Changes in Account Receivables | ||||||||||
| Changes in Inventories | ||||||||||
| Changes in Accounts Payable | ||||||||||
| Capital Expenditure | ||||||||||
| UFCF | -150,475.4 | -5,065.6 | 4,035.2 | 9,998.9 | -11,966.3 | 39,720.7 | 13,864.9 | 14,431.4 | 15,021.1 | 15,634.8 |
| WACC, % | 4.41 | 4.41 | 4.39 | 4.35 | 4.4 | 4.39 | 4.39 | 4.39 | 4.39 | 4.39 |
| PV UFCF | ||||||||||
| SUM PV UFCF | 88,714.8 | |||||||||
| Long Term Growth Rate, % | 2.00 | |||||||||
| Free cash flow (T + 1) | 15,947 | |||||||||
| Terminal Value | 666,351 | |||||||||
| Present Terminal Value | 537,453 | |||||||||
| Enterprise Value | 626,168 | |||||||||
| Net Debt | 89,179 | |||||||||
| Equity Value | 536,989 | |||||||||
| Diluted Shares Outstanding, MM | 208 | |||||||||
| Equity Value Per Share | 2,577.87 |
Benefits You Will Receive
- Comprehensive EXEO Financial Data: Includes historical and projected data for EXEO Group, Inc. (1951T) enabling accurate analysis.
- Customizable Template: Effortlessly adjust key inputs such as revenue growth, WACC, and EBITDA %.
- Instant Calculations: Observe the immediate update of EXEO’s intrinsic value as you modify inputs.
- Professional Valuation Tool: Tailored for investors, analysts, and consultants seeking reliable DCF outcomes.
- Intuitive Design: Features a straightforward layout and easy-to-follow instructions suitable for all experience levels.
Key Features
- Comprehensive EXEO Data: Comes pre-loaded with EXEO Group's historical performance metrics and future growth forecasts.
- Customizable Parameters: Tailor revenue growth, profit margins, discount rates, tax assumptions, and capital investments to your needs.
- Interactive Valuation Framework: Automatically recalculates Net Present Value (NPV) and intrinsic value as you adjust inputs.
- Multiple Scenario Analysis: Develop various forecasting scenarios to evaluate distinct valuation results.
- Intuitive Interface: Designed for ease of use, catering to both seasoned professionals and newcomers.
How It Works
- Step 1: Download the pre-built Excel template that includes data for EXEO Group, Inc. (1951T).
- Step 2: Review the pre-filled sheets to familiarize yourself with the essential metrics.
- Step 3: Modify forecasts and assumptions in the editable yellow cells (WACC, growth, margins).
- Step 4: Instantly see the recalculated results, including the intrinsic value of EXEO Group, Inc. (1951T).
- Step 5: Use the outputs to make informed investment decisions or to create detailed reports.
Why Opt for the EXEO Group, Inc. Calculator?
- All-in-One Solution: Features DCF, WACC, and financial ratio analyses seamlessly integrated.
- Flexible Inputs: Modify yellow-highlighted fields to explore different scenarios.
- In-Depth Analysis: Automatically determines the intrinsic value and Net Present Value for EXEO Group, Inc. (1951T).
- Loaded with Data: Access historical and projected data for reliable benchmarks.
- High-Quality Standards: Perfect for financial analysts, investors, and business consultants.
Who Should Consider EXEO Group, Inc. (1951T)?
- Individual Investors: Gain insights to make educated decisions regarding investments in EXEO Group, Inc. (1951T).
- Financial Analysts: Enhance your valuation methods with comprehensive financial models tailored for EXEO Group, Inc. (1951T).
- Consultants: Provide clients with accurate and timely valuation analysis of EXEO Group, Inc. (1951T).
- Business Owners: Learn from the valuation strategies of established entities like EXEO Group, Inc. (1951T) to inform your business approach.
- Finance Students: Apply real-world data and scenarios to master valuation techniques using EXEO Group, Inc. (1951T) as a case study.
Contents of the Template
- Detailed DCF Model: An editable template featuring comprehensive valuation calculations.
- Actual Financial Data: Historical and forecasted financials for EXEO Group, Inc. (1951T) included for thorough analysis.
- Flexible Parameters: Modify WACC, growth rates, and tax assumptions to explore different scenarios.
- Financial Statements: Complete annual and quarterly financial breakdowns for enhanced insights.
- Essential Ratios: Integrated analysis covering profitability, efficiency, and leverage metrics.
- Visual Dashboard: Interactive charts and tables presenting clear, actionable results.
Disclaimer
All information, articles, and product details provided on this website are for general informational and educational purposes only. We do not claim any ownership over, nor do we intend to infringe upon, any trademarks, copyrights, logos, brand names, or other intellectual property mentioned or depicted on this site. Such intellectual property remains the property of its respective owners, and any references here are made solely for identification or informational purposes, without implying any affiliation, endorsement, or partnership.
We make no representations or warranties, express or implied, regarding the accuracy, completeness, or suitability of any content or products presented. Nothing on this website should be construed as legal, tax, investment, financial, medical, or other professional advice. In addition, no part of this site—including articles or product references—constitutes a solicitation, recommendation, endorsement, advertisement, or offer to buy or sell any securities, franchises, or other financial instruments, particularly in jurisdictions where such activity would be unlawful.
All content is of a general nature and may not address the specific circumstances of any individual or entity. It is not a substitute for professional advice or services. Any actions you take based on the information provided here are strictly at your own risk. You accept full responsibility for any decisions or outcomes arising from your use of this website and agree to release us from any liability in connection with your use of, or reliance upon, the content or products found herein.