
|
Adama Ltd. (200553.sz) Valoración de DCF |
Completamente Editable: Adáptelo A Sus Necesidades En Excel O Sheets
Diseño Profesional: Plantillas Confiables Y Estándares De La Industria
Predeterminadas Para Un Uso Rápido Y Eficiente
Compatible con MAC / PC, completamente desbloqueado
No Se Necesita Experiencia; Fáciles De Seguir
ADAMA Ltd. (200553.SZ) Bundle
¡Evalúe la perspectiva financiera de Adama Ltd. como un experto! Esta calculadora DCF (200553SZ) proporciona datos financieros previamente poblados junto con la flexibilidad para modificar el crecimiento de los ingresos, WACC, los márgenes y otros supuestos esenciales para alinearse con sus proyecciones.
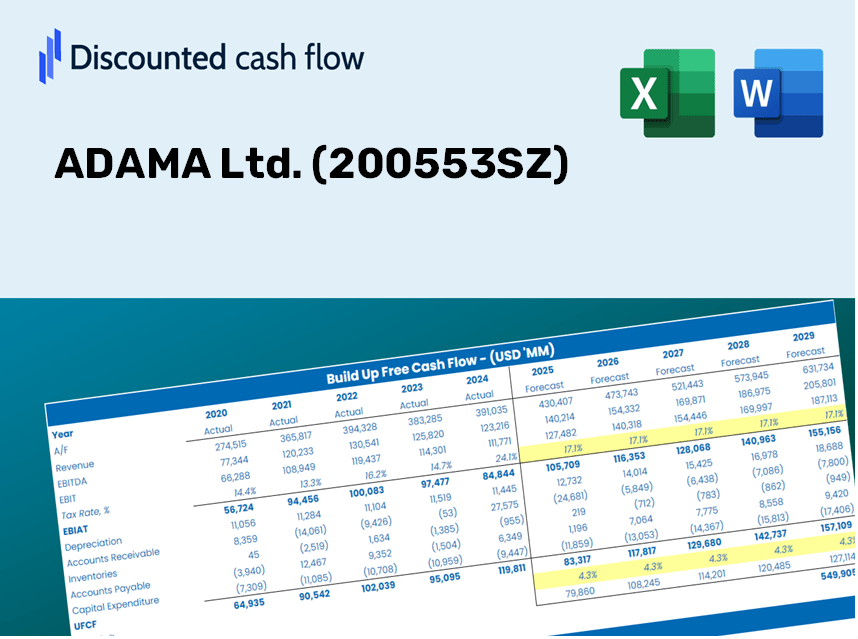
Discounted Cash Flow (DCF) - (USD MM)
| Year | AY1 2020 |
AY2 2021 |
AY3 2022 |
AY4 2023 |
AY5 2024 |
FY1 2025 |
FY2 2026 |
FY3 2027 |
FY4 2028 |
FY5 2029 |
|---|---|---|---|---|---|---|---|---|---|---|
| Revenue | 31,175.8 | 34,018.6 | 40,971.0 | 35,926.6 | 32,319.2 | 32,901.1 | 33,493.6 | 34,096.6 | 34,710.6 | 35,335.6 |
| Revenue Growth, % | 0 | 9.12 | 20.44 | -12.31 | -10.04 | 1.8 | 1.8 | 1.8 | 1.8 | 1.8 |
| EBITDA | 3,963.7 | 4,023.8 | 4,814.1 | 2,006.0 | 1,214.5 | 3,002.8 | 3,056.9 | 3,111.9 | 3,167.9 | 3,225.0 |
| EBITDA, % | 12.71 | 11.83 | 11.75 | 5.58 | 3.76 | 9.13 | 9.13 | 9.13 | 9.13 | 9.13 |
| Depreciation | 2,474.0 | 2,129.0 | 2,341.8 | 2,288.1 | 2,373.6 | 2,212.5 | 2,252.3 | 2,292.8 | 2,334.1 | 2,376.2 |
| Depreciation, % | 7.94 | 6.26 | 5.72 | 6.37 | 7.34 | 6.72 | 6.72 | 6.72 | 6.72 | 6.72 |
| EBIT | 1,489.7 | 1,894.8 | 2,472.3 | -282.1 | -1,159.1 | 790.3 | 804.6 | 819.1 | 833.8 | 848.8 |
| EBIT, % | 4.78 | 5.57 | 6.03 | -0.78533 | -3.59 | 2.4 | 2.4 | 2.4 | 2.4 | 2.4 |
| Total Cash | 4,236.2 | 6,379.1 | 4,704.8 | 5,352.1 | 3,980.3 | 4,674.3 | 4,758.5 | 4,844.2 | 4,931.4 | 5,020.2 |
| Total Cash, percent | .0 | .0 | .0 | .0 | .0 | .0 | .0 | .0 | .0 | .0 |
| Account Receivables | 11,823.3 | 10,819.8 | 11,941.7 | 9,158.3 | 10,231.9 | 10,267.0 | 10,451.8 | 10,640.0 | 10,831.6 | 11,026.6 |
| Account Receivables, % | 37.92 | 31.81 | 29.15 | 25.49 | 31.66 | 31.21 | 31.21 | 31.21 | 31.21 | 31.21 |
| Inventories | 11,330.9 | 12,878.3 | 18,552.4 | 14,345.4 | 12,236.6 | 12,981.1 | 13,214.9 | 13,452.8 | 13,695.1 | 13,941.6 |
| Inventories, % | 36.34 | 37.86 | 45.28 | 39.93 | 37.86 | 39.45 | 39.45 | 39.45 | 39.45 | 39.45 |
| Accounts Payable | 2,281.3 | 3,847.0 | 4,741.7 | 2,328.1 | 5,890.4 | 3,612.9 | 3,677.9 | 3,744.2 | 3,811.6 | 3,880.2 |
| Accounts Payable, % | 7.32 | 11.31 | 11.57 | 6.48 | 18.23 | 10.98 | 10.98 | 10.98 | 10.98 | 10.98 |
| Capital Expenditure | -2,158.9 | -2,838.1 | -2,923.3 | -2,597.3 | -1,560.2 | -2,267.5 | -2,308.4 | -2,349.9 | -2,392.2 | -2,435.3 |
| Capital Expenditure, % | -6.92 | -8.34 | -7.14 | -7.23 | -4.83 | -6.89 | -6.89 | -6.89 | -6.89 | -6.89 |
| Tax Rate, % | -36.67 | -36.67 | -36.67 | -36.67 | -36.67 | -36.67 | -36.67 | -36.67 | -36.67 | -36.67 |
| EBITAT | 913.6 | 548.4 | 1,990.6 | -322.5 | -1,584.0 | 586.1 | 596.6 | 607.4 | 618.3 | 629.5 |
| Depreciation | ||||||||||
| Changes in Account Receivables | ||||||||||
| Changes in Inventories | ||||||||||
| Changes in Accounts Payable | ||||||||||
| Capital Expenditure | ||||||||||
| UFCF | -19,644.2 | 861.1 | -4,492.2 | 3,945.1 | 3,826.8 | -2,526.0 | 187.0 | 190.4 | 193.8 | 197.3 |
| WACC, % | 4.9 | 3.12 | 5.96 | 7.03 | 7.03 | 5.61 | 5.61 | 5.61 | 5.61 | 5.61 |
| PV UFCF | ||||||||||
| SUM PV UFCF | -1,756.5 | |||||||||
| Long Term Growth Rate, % | 2.00 | |||||||||
| Free cash flow (T + 1) | 201 | |||||||||
| Terminal Value | 5,583 | |||||||||
| Present Terminal Value | 4,250 | |||||||||
| Enterprise Value | 2,494 | |||||||||
| Net Debt | 11,196 | |||||||||
| Equity Value | -8,702 | |||||||||
| Diluted Shares Outstanding, MM | 2,330 | |||||||||
| Equity Value Per Share | -3.74 |
What You Will Receive
- Customizable Excel Template: A fully adjustable Excel-based DCF Calculator featuring pre-filled financial data for ADAMA Ltd. (200553SZ).
- Relevant Data: Access to historical data and future projections (indicated in the highlighted cells).
- Flexible Forecasting: Modify key assumptions such as revenue growth, EBITDA margin, and WACC.
- Instant Calculations: Quickly observe how your inputs influence ADAMA's valuation.
- Professional Resource: Designed for investors, CFOs, consultants, and financial analysts.
- Intuitive Layout: Organized for simplicity and ease of use, complete with step-by-step guidance.
Key Features
- Accurate Financial Data for ADAMA Ltd.: Access reliable pre-loaded historical metrics and future forecasts.
- Customizable Forecast Inputs: Modify highlighted cells for key variables like WACC, growth rates, and profit margins.
- Real-Time Calculations: Automatic updates for DCF, Net Present Value (NPV), and cash flow assessments.
- User-Friendly Dashboard: Clear charts and summaries to help you visualize valuation outcomes.
- Designed for All Skill Levels: An intuitive layout suitable for investors, CFOs, and consultants alike.
How It Works
- Download the Template: Gain immediate access to the Excel-based ADAMA Ltd. DCF Calculator.
- Input Your Assumptions: Modify the yellow-highlighted cells for growth rates, WACC, margins, and other variables.
- Instant Calculations: The model automatically recalculates ADAMA Ltd.'s intrinsic value.
- Test Scenarios: Experiment with various assumptions to assess potential valuation outcomes.
- Analyze and Decide: Leverage the insights to inform your investment or financial strategy.
Why Choose This Calculator for ADAMA Ltd. (200553SZ)?
- User-Friendly Interface: Perfect for both novices and seasoned professionals.
- Customizable Parameters: Adjust inputs effortlessly to suit your analysis needs.
- Real-Time Adjustments: Observe immediate shifts in ADAMA Ltd.’s valuation as you modify inputs.
- Preloaded Financial Data: Comes equipped with ADAMA Ltd.’s actual financial figures for rapid evaluations.
- Relied Upon by Experts: A go-to tool for investors and analysts for making well-informed choices.
Who Should Use ADAMA Ltd. (200553SZ)?
- Agricultural Investors: Make informed investment decisions with our industry-leading valuation tool.
- Financial Analysts: Streamline your workflow with a ready-to-customize DCF model designed for the agriculture sector.
- Consultants: Effortlessly modify the template for impactful client presentations and reports.
- Agribusiness Enthusiasts: Enhance your knowledge of valuation methods with practical, real-world applications.
- Students and Educators: Utilize this tool as an effective resource in finance and agriculture-related academic courses.
Contents of the Template
- Preloaded ADAMA Data: Historical and projected financial information, including revenue, EBIT, and capital expenditures.
- DCF and WACC Models: Professional-grade sheets designed for calculating intrinsic value and Weighted Average Cost of Capital.
- Editable Inputs: Yellow-highlighted cells to customize revenue growth, tax rates, and discount rates.
- Financial Statements: Detailed annual and quarterly financials for in-depth analysis.
- Key Ratios: Metrics for profitability, leverage, and efficiency to assess performance.
- Dashboard and Charts: Visual overviews of valuation results and key assumptions.
Disclaimer
All information, articles, and product details provided on this website are for general informational and educational purposes only. We do not claim any ownership over, nor do we intend to infringe upon, any trademarks, copyrights, logos, brand names, or other intellectual property mentioned or depicted on this site. Such intellectual property remains the property of its respective owners, and any references here are made solely for identification or informational purposes, without implying any affiliation, endorsement, or partnership.
We make no representations or warranties, express or implied, regarding the accuracy, completeness, or suitability of any content or products presented. Nothing on this website should be construed as legal, tax, investment, financial, medical, or other professional advice. In addition, no part of this site—including articles or product references—constitutes a solicitation, recommendation, endorsement, advertisement, or offer to buy or sell any securities, franchises, or other financial instruments, particularly in jurisdictions where such activity would be unlawful.
All content is of a general nature and may not address the specific circumstances of any individual or entity. It is not a substitute for professional advice or services. Any actions you take based on the information provided here are strictly at your own risk. You accept full responsibility for any decisions or outcomes arising from your use of this website and agree to release us from any liability in connection with your use of, or reliance upon, the content or products found herein.