
|
Bengang Steel Plates Co., Ltd. (200761.sz) Valoración de DCF |
Completamente Editable: Adáptelo A Sus Necesidades En Excel O Sheets
Diseño Profesional: Plantillas Confiables Y Estándares De La Industria
Predeterminadas Para Un Uso Rápido Y Eficiente
Compatible con MAC / PC, completamente desbloqueado
No Se Necesita Experiencia; Fáciles De Seguir
Bengang Steel Plates Co., Ltd. (200761.SZ) Bundle
¡Descubra el verdadero potencial de Bengang Steel Plates Co., Ltd. (200761sz) con nuestra calculadora DCF avanzada! Ajuste los supuestos esenciales, explore varios escenarios y evalúe cómo los diferentes cambios afectan la valoración de Bengang Steel Plates Co., Ltd. (200761sz), todo dentro de una sola plantilla de Excel.
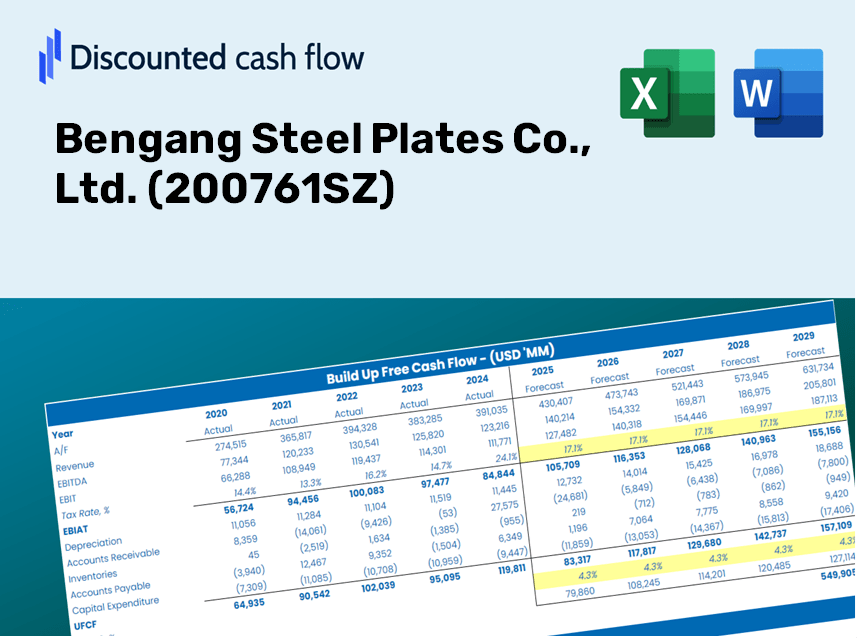
Discounted Cash Flow (DCF) - (USD MM)
| Year | AY1 2020 |
AY2 2021 |
AY3 2022 |
AY4 2023 |
AY5 2024 |
FY1 2025 |
FY2 2026 |
FY3 2027 |
FY4 2028 |
FY5 2029 |
|---|---|---|---|---|---|---|---|---|---|---|
| Revenue | 53,143.5 | 85,047.6 | 68,351.3 | 63,109.9 | 55,961.5 | 58,956.4 | 62,111.6 | 65,435.7 | 68,937.6 | 72,627.0 |
| Revenue Growth, % | 0 | 60.03 | -19.63 | -7.67 | -11.33 | 5.35 | 5.35 | 5.35 | 5.35 | 5.35 |
| EBITDA | 4,001.0 | 7,471.0 | 1,677.1 | 594.6 | -3,014.7 | 1,688.7 | 1,779.1 | 1,874.3 | 1,974.6 | 2,080.3 |
| EBITDA, % | 7.53 | 8.78 | 2.45 | 0.94223 | -5.39 | 2.86 | 2.86 | 2.86 | 2.86 | 2.86 |
| Depreciation | 2,398.9 | 2,621.0 | 2,193.3 | 1,850.8 | 1,881.1 | 2,016.1 | 2,124.0 | 2,237.7 | 2,357.5 | 2,483.6 |
| Depreciation, % | 4.51 | 3.08 | 3.21 | 2.93 | 3.36 | 3.42 | 3.42 | 3.42 | 3.42 | 3.42 |
| EBIT | 1,602.1 | 4,850.0 | -516.2 | -1,256.2 | -4,895.7 | -327.4 | -344.9 | -363.4 | -382.8 | -403.3 |
| EBIT, % | 3.01 | 5.7 | -0.75515 | -1.99 | -8.75 | -0.55532 | -0.55532 | -0.55532 | -0.55532 | -0.55532 |
| Total Cash | 14,328.9 | 9,639.9 | 1,595.0 | 2,395.6 | 2,678.6 | 5,802.9 | 6,113.4 | 6,440.6 | 6,785.3 | 7,148.4 |
| Total Cash, percent | .0 | .0 | .0 | .0 | .0 | .0 | .0 | .0 | .0 | .0 |
| Account Receivables | 4,996.5 | 3,814.0 | 1,737.5 | 2,826.0 | 1,443.3 | 2,769.2 | 2,917.4 | 3,073.6 | 3,238.1 | 3,411.4 |
| Account Receivables, % | 9.4 | 4.48 | 2.54 | 4.48 | 2.58 | 4.7 | 4.7 | 4.7 | 4.7 | 4.7 |
| Inventories | 9,868.0 | 11,123.4 | 9,238.9 | 8,414.3 | 8,004.7 | 8,584.2 | 9,043.6 | 9,527.6 | 10,037.5 | 10,574.6 |
| Inventories, % | 18.57 | 13.08 | 13.52 | 13.33 | 14.3 | 14.56 | 14.56 | 14.56 | 14.56 | 14.56 |
| Accounts Payable | 15,441.6 | 10,902.0 | 7,404.9 | 14,381.0 | 17,186.4 | 12,523.2 | 13,193.4 | 13,899.5 | 14,643.3 | 15,427.0 |
| Accounts Payable, % | 29.06 | 12.82 | 10.83 | 22.79 | 30.71 | 21.24 | 21.24 | 21.24 | 21.24 | 21.24 |
| Capital Expenditure | -1,106.8 | -1,424.5 | -1,863.8 | -1,084.3 | -1,064.5 | -1,191.5 | -1,255.2 | -1,322.4 | -1,393.2 | -1,467.8 |
| Capital Expenditure, % | -2.08 | -1.67 | -2.73 | -1.72 | -1.9 | -2.02 | -2.02 | -2.02 | -2.02 | -2.02 |
| Tax Rate, % | -3.44 | -3.44 | -3.44 | -3.44 | -3.44 | -3.44 | -3.44 | -3.44 | -3.44 | -3.44 |
| EBITAT | 1,476.8 | 3,530.2 | -576.0 | -1,389.3 | -5,064.2 | -304.5 | -320.8 | -337.9 | -356.0 | -375.1 |
| Depreciation | ||||||||||
| Changes in Account Receivables | ||||||||||
| Changes in Inventories | ||||||||||
| Changes in Accounts Payable | ||||||||||
| Capital Expenditure | ||||||||||
| UFCF | 3,346.1 | 114.1 | 217.3 | 6,089.4 | 350.1 | -6,048.5 | 610.6 | 643.3 | 677.8 | 714.0 |
| WACC, % | 4.49 | 4 | 4.69 | 4.69 | 4.69 | 4.51 | 4.51 | 4.51 | 4.51 | 4.51 |
| PV UFCF | ||||||||||
| SUM PV UFCF | -3,524.0 | |||||||||
| Long Term Growth Rate, % | 2.00 | |||||||||
| Free cash flow (T + 1) | 728 | |||||||||
| Terminal Value | 28,998 | |||||||||
| Present Terminal Value | 23,257 | |||||||||
| Enterprise Value | 19,733 | |||||||||
| Net Debt | 8,747 | |||||||||
| Equity Value | 10,986 | |||||||||
| Diluted Shares Outstanding, MM | 4,109 | |||||||||
| Equity Value Per Share | 2.67 |
Benefits You Will Experience
- Comprehensive BSP Financial Data: Pre-loaded with Bengang Steel Plates Co., Ltd.’s historical and forecasted data for thorough analysis.
- Customizable Template: Easily adjust essential parameters like revenue growth, WACC, and EBITDA % to suit your needs.
- Instant Calculations: Watch the intrinsic value of Bengang Steel Plates Co., Ltd. update in real-time as you modify inputs.
- Expert Valuation Tool: Tailored for investors, analysts, and consultants aiming for precise DCF assessments.
- User-Friendly Interface: A straightforward layout and clear guidance suitable for users of all backgrounds.
Key Features
- Flexible Pricing Inputs: Adjust essential variables such as revenue growth rates, EBITDA margins, and capital investment requirements.
- Instant DCF Valuation: Automatically computes intrinsic value, net present value (NPV), and other relevant financial metrics.
- High-Precision Accuracy: Leverages real-world financial data from Bengang Steel Plates Co., Ltd. for precise valuation assessments.
- Simplified Scenario Analysis: Effortlessly evaluate various assumptions and analyze the resulting outcomes.
- Efficiency Booster: Save time by removing the need to construct intricate valuation models from the ground up.
How It Functions
- Download the Template: Gain immediate access to the Excel-based Bengang Steel Plates DCF Calculator.
- Input Your Assumptions: Modify the yellow-highlighted cells for growth rates, WACC, profit margins, and more.
- Instant Calculations: The model will automatically refresh to show the intrinsic value of Bengang Steel Plates Co., Ltd. (200761SZ).
- Test Scenarios: Experiment with different assumptions to assess potential changes in valuation.
- Analyze and Decide: Utilize the results to inform your investment strategy or financial assessment.
Why Choose This Calculator for Bengang Steel Plates Co., Ltd. (200761SZ)?
- Reliable Data: Use actual financial figures from Bengang Steel to ensure accurate valuation outcomes.
- Flexible Settings: Tailor essential metrics such as growth rates, WACC, and tax rates to fit your forecasts.
- Efficiency Boost: Ready-made calculations save you time and effort, eliminating the need for a fresh start.
- Expert-Level Tool: Crafted for investors, analysts, and consultants working with Bengang Steel.
- Accessible Design: An easy-to-navigate interface with step-by-step guidance for all users.
Who Should Use This Product?
- Individual Investors: Make well-informed decisions regarding the purchase or sale of Bengang Steel Plates Co., Ltd. (200761SZ) stock.
- Financial Analysts: Enhance valuation processes with easily accessible financial models tailored for Bengang Steel Plates Co., Ltd. (200761SZ).
- Consultants: Provide accurate and timely valuation insights to clients focused on Bengang Steel Plates Co., Ltd. (200761SZ).
- Business Owners: Gain insights into the valuation of large companies like Bengang Steel Plates Co., Ltd. (200761SZ) to inform your own business strategies.
- Finance Students: Develop valuation skills using real-time data and case studies from companies like Bengang Steel Plates Co., Ltd. (200761SZ).
Contents of the Template
- Pre-Filled DCF Model: Bengang Steel Plates Co., Ltd.’s financial data preloaded for immediate analysis.
- WACC Calculator: Comprehensive calculations for the Weighted Average Cost of Capital.
- Financial Ratios: Assess Bengang Steel's profitability, leverage, and operational efficiency.
- Editable Inputs: Modify assumptions like growth rates, margins, and CAPEX to suit your analysis.
- Financial Statements: Access annual and quarterly reports for in-depth evaluation.
- Interactive Dashboard: Effortlessly visualize essential valuation metrics and outcomes.
Disclaimer
All information, articles, and product details provided on this website are for general informational and educational purposes only. We do not claim any ownership over, nor do we intend to infringe upon, any trademarks, copyrights, logos, brand names, or other intellectual property mentioned or depicted on this site. Such intellectual property remains the property of its respective owners, and any references here are made solely for identification or informational purposes, without implying any affiliation, endorsement, or partnership.
We make no representations or warranties, express or implied, regarding the accuracy, completeness, or suitability of any content or products presented. Nothing on this website should be construed as legal, tax, investment, financial, medical, or other professional advice. In addition, no part of this site—including articles or product references—constitutes a solicitation, recommendation, endorsement, advertisement, or offer to buy or sell any securities, franchises, or other financial instruments, particularly in jurisdictions where such activity would be unlawful.
All content is of a general nature and may not address the specific circumstances of any individual or entity. It is not a substitute for professional advice or services. Any actions you take based on the information provided here are strictly at your own risk. You accept full responsibility for any decisions or outcomes arising from your use of this website and agree to release us from any liability in connection with your use of, or reliance upon, the content or products found herein.