
|
Xinjiang Goldwind Science & Technology Co., Ltd. (2208.HK) Valoración de DCF |
Completamente Editable: Adáptelo A Sus Necesidades En Excel O Sheets
Diseño Profesional: Plantillas Confiables Y Estándares De La Industria
Predeterminadas Para Un Uso Rápido Y Eficiente
Compatible con MAC / PC, completamente desbloqueado
No Se Necesita Experiencia; Fáciles De Seguir
Xinjiang Goldwind Science & Technology Co., Ltd. (2208.HK) Bundle
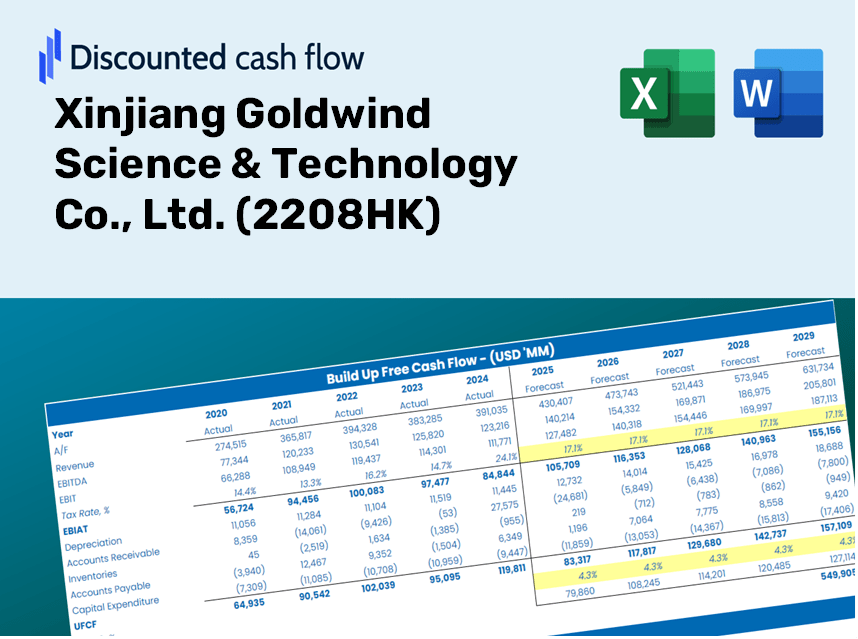
Simplifique la ciencia de Goldwind de Xinjiang Gold & Technology Co., Ltd. (2208HK) Valoración con esta calculadora DCF personalizable! Con el verdadero Xinjiang Goldwind Financials y las entradas de pronóstico ajustables, puede probar escenarios y descubrir el valor razonable de Xinjiang Goldwind en minutos.
Discounted Cash Flow (DCF) - (USD MM)
| Year | AY1 2020 |
AY2 2021 |
AY3 2022 |
AY4 2023 |
AY5 2024 |
FY1 2025 |
FY2 2026 |
FY3 2027 |
FY4 2028 |
FY5 2029 |
|---|---|---|---|---|---|---|---|---|---|---|
| Revenue | 61,660.4 | 55,420.0 | 50,889.7 | 55,295.5 | 62,136.1 | 62,560.7 | 62,988.2 | 63,418.6 | 63,852.0 | 64,288.3 |
| Revenue Growth, % | 0 | -10.12 | -8.17 | 8.66 | 12.37 | 0.68335 | 0.68335 | 0.68335 | 0.68335 | 0.68335 |
| EBITDA | 6,699.9 | 8,884.4 | 7,505.4 | 7,333.6 | 7,339.7 | 8,348.1 | 8,405.2 | 8,462.6 | 8,520.4 | 8,578.6 |
| EBITDA, % | 10.87 | 16.03 | 14.75 | 13.26 | 11.81 | 13.34 | 13.34 | 13.34 | 13.34 | 13.34 |
| Depreciation | 2,146.1 | 2,552.2 | 3,005.8 | 3,067.1 | 3,701.0 | 3,190.0 | 3,211.8 | 3,233.7 | 3,255.8 | 3,278.1 |
| Depreciation, % | 3.48 | 4.61 | 5.91 | 5.55 | 5.96 | 5.1 | 5.1 | 5.1 | 5.1 | 5.1 |
| EBIT | 4,553.8 | 6,332.1 | 4,499.7 | 4,266.5 | 3,638.7 | 5,158.1 | 5,193.4 | 5,228.9 | 5,264.6 | 5,300.6 |
| EBIT, % | 7.39 | 11.43 | 8.84 | 7.72 | 5.86 | 8.24 | 8.24 | 8.24 | 8.24 | 8.24 |
| Total Cash | 9,615.2 | 9,838.1 | 17,674.5 | 16,378.3 | 13,829.5 | 15,008.7 | 15,111.3 | 15,214.5 | 15,318.5 | 15,423.2 |
| Total Cash, percent | .0 | .0 | .0 | .0 | .0 | .0 | .0 | .0 | .0 | .0 |
| Account Receivables | 26,553.5 | 30,044.4 | 31,259.7 | 30,563.6 | 40,523.2 | 34,933.0 | 35,171.7 | 35,412.0 | 35,654.0 | 35,897.7 |
| Account Receivables, % | 43.06 | 54.21 | 61.43 | 55.27 | 65.22 | 55.84 | 55.84 | 55.84 | 55.84 | 55.84 |
| Inventories | 6,265.9 | 5,279.5 | 10,792.0 | 16,720.3 | 16,249.5 | 12,172.3 | 12,255.5 | 12,339.3 | 12,423.6 | 12,508.5 |
| Inventories, % | 10.16 | 9.53 | 21.21 | 30.24 | 26.15 | 19.46 | 19.46 | 19.46 | 19.46 | 19.46 |
| Accounts Payable | 31,353.5 | 34,932.7 | 43,323.9 | 45,638.1 | 44,689.2 | 44,226.7 | 44,528.9 | 44,833.2 | 45,139.6 | 45,448.0 |
| Accounts Payable, % | 50.85 | 63.03 | 85.13 | 82.53 | 71.92 | 70.69 | 70.69 | 70.69 | 70.69 | 70.69 |
| Capital Expenditure | -8,395.3 | -11,713.5 | -9,890.9 | -7,425.6 | -8,406.1 | -10,152.9 | -10,222.3 | -10,292.1 | -10,362.5 | -10,433.3 |
| Capital Expenditure, % | -13.62 | -21.14 | -19.44 | -13.43 | -13.53 | -16.23 | -16.23 | -16.23 | -16.23 | -16.23 |
| Tax Rate, % | 11.57 | 11.57 | 11.57 | 11.57 | 11.57 | 11.57 | 11.57 | 11.57 | 11.57 | 11.57 |
| EBITAT | 4,122.5 | 5,445.1 | 3,869.2 | 2,254.2 | 3,217.8 | 4,165.5 | 4,193.9 | 4,222.6 | 4,251.4 | 4,280.5 |
| Depreciation | ||||||||||
| Changes in Account Receivables | ||||||||||
| Changes in Inventories | ||||||||||
| Changes in Accounts Payable | ||||||||||
| Capital Expenditure | ||||||||||
| UFCF | -3,592.6 | -2,641.4 | -1,352.4 | -5,022.4 | -11,925.0 | 6,407.5 | -2,836.2 | -2,855.6 | -2,875.1 | -2,894.8 |
| WACC, % | 5.48 | 5.41 | 5.41 | 4.92 | 5.45 | 5.34 | 5.34 | 5.34 | 5.34 | 5.34 |
| PV UFCF | ||||||||||
| SUM PV UFCF | -3,484.0 | |||||||||
| Long Term Growth Rate, % | 2.00 | |||||||||
| Free cash flow (T + 1) | -2,953 | |||||||||
| Terminal Value | -88,505 | |||||||||
| Present Terminal Value | -68,247 | |||||||||
| Enterprise Value | -71,731 | |||||||||
| Net Debt | 25,949 | |||||||||
| Equity Value | -97,680 | |||||||||
| Diluted Shares Outstanding, MM | 4,582 | |||||||||
| Equity Value Per Share | -21.32 |
What You Will Receive
- Flexible Forecast Inputs: Easily adjust assumptions (growth %, margins, WACC) to generate various scenarios.
- Comprehensive Data: Financial data for Xinjiang Goldwind Science & Technology Co., Ltd. (2208HK) pre-loaded to accelerate your analysis.
- Automatic DCF Outputs: The model automatically computes Net Present Value (NPV) and intrinsic value for you.
- Customizable and Professional: A refined Excel template tailored to fit your valuation requirements.
- Designed for Analysts and Investors: Perfect for testing forecasts, validating investment strategies, and enhancing efficiency.
Key Features
- Comprehensive DCF Calculator: Features detailed unlevered and levered DCF valuation models tailored for Xinjiang Goldwind Science & Technology Co., Ltd. (2208HK).
- WACC Calculator: Ready-to-use Weighted Average Cost of Capital sheet with easily adjustable inputs.
- Customizable Forecast Assumptions: Adjust growth rates, capital expenditures, and discount rates as needed.
- Integrated Financial Ratios: Review profitability, leverage, and efficiency ratios specific to Xinjiang Goldwind (2208HK).
- Interactive Dashboard and Charts: Visual presentations of key valuation metrics facilitate straightforward analysis.
How It Works
- Step 1: Download the Excel file.
- Step 2: Examine the pre-filled financial data and projections for Xinjiang Goldwind Science & Technology Co., Ltd. (2208HK).
- Step 3: Adjust key inputs such as revenue growth, WACC, and tax rates (highlighted cells).
- Step 4: Observe the DCF model refresh in real-time as you modify your assumptions.
- Step 5: Review the outputs and leverage the findings for your investment strategies.
Why Opt for This Calculator?
- Reliable Data: Utilize authentic financial information from Xinjiang Goldwind Science & Technology Co., Ltd. ([2208HK]) for trustworthy valuation outcomes.
- Flexible Customization: Modify essential parameters such as growth rates, WACC, and tax rates to align with your forecasts.
- Efficiency Boost: Built-in calculations remove the hassle of starting from the ground up.
- High-Quality Tool: Tailored for investors, analysts, and consultants in the field.
- Easy to Use: User-friendly design and clear step-by-step guidance make it accessible for everyone.
Who Can Benefit from This Product?
- Investors: Assess the valuation of Xinjiang Goldwind Science & Technology Co., Ltd. (2208HK) prior to making trading decisions.
- CFOs and Financial Analysts: Enhance the efficiency of valuation processes and evaluate financial forecasts.
- Startup Founders: Gain insights into the valuation methods used for established companies like Xinjiang Goldwind (2208HK).
- Consultants: Provide detailed valuation reports for your clients based on industry standards.
- Students and Educators: Utilize real-world examples to learn and instruct on valuation practices.
Components of the Template
- Pre-Filled Data: Features historical financial data and projections for Xinjiang Goldwind Science & Technology Co., Ltd. (2208HK).
- Discounted Cash Flow Model: An editable DCF valuation model that performs automatic calculations.
- Weighted Average Cost of Capital (WACC): A dedicated sheet for calculating WACC using customized inputs.
- Key Financial Ratios: Evaluate Xinjiang Goldwind's profitability, efficiency, and leverage.
- Customizable Inputs: Easily adjust revenue growth, margins, and tax rates.
- Clear Dashboard: Visual representations and tables highlighting essential valuation outcomes.
Disclaimer
All information, articles, and product details provided on this website are for general informational and educational purposes only. We do not claim any ownership over, nor do we intend to infringe upon, any trademarks, copyrights, logos, brand names, or other intellectual property mentioned or depicted on this site. Such intellectual property remains the property of its respective owners, and any references here are made solely for identification or informational purposes, without implying any affiliation, endorsement, or partnership.
We make no representations or warranties, express or implied, regarding the accuracy, completeness, or suitability of any content or products presented. Nothing on this website should be construed as legal, tax, investment, financial, medical, or other professional advice. In addition, no part of this site—including articles or product references—constitutes a solicitation, recommendation, endorsement, advertisement, or offer to buy or sell any securities, franchises, or other financial instruments, particularly in jurisdictions where such activity would be unlawful.
All content is of a general nature and may not address the specific circumstances of any individual or entity. It is not a substitute for professional advice or services. Any actions you take based on the information provided here are strictly at your own risk. You accept full responsibility for any decisions or outcomes arising from your use of this website and agree to release us from any liability in connection with your use of, or reliance upon, the content or products found herein.