
|
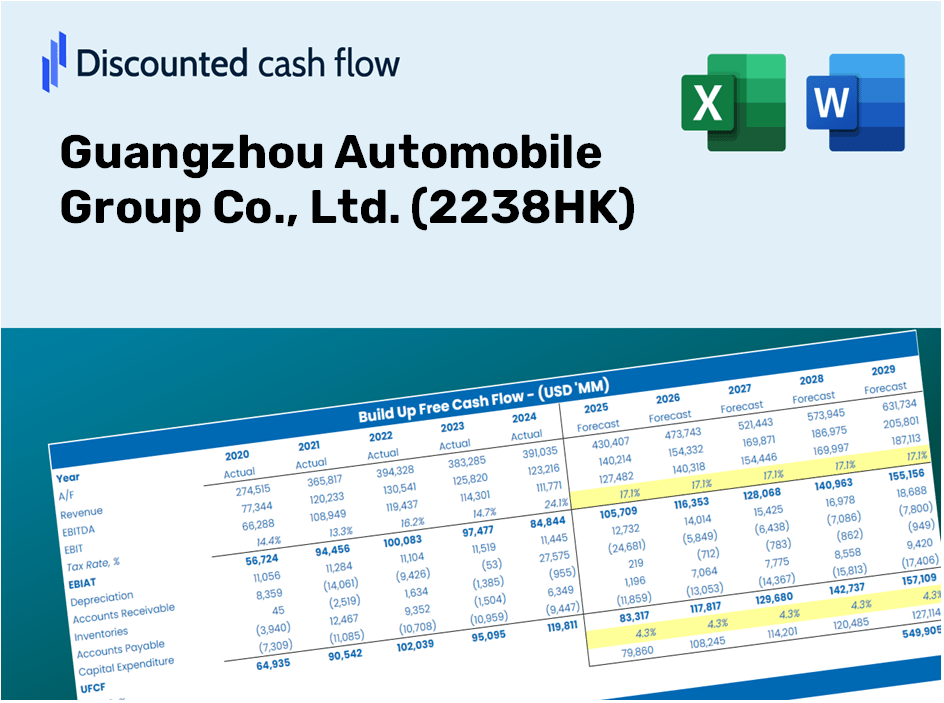
Guangzhou Automobile Group Co., Ltd. (2238.HK) Valoración de DCF |
Completamente Editable: Adáptelo A Sus Necesidades En Excel O Sheets
Diseño Profesional: Plantillas Confiables Y Estándares De La Industria
Predeterminadas Para Un Uso Rápido Y Eficiente
Compatible con MAC / PC, completamente desbloqueado
No Se Necesita Experiencia; Fáciles De Seguir
Guangzhou Automobile Group Co., Ltd. (2238.HK) Bundle
Ya sea que sea un inversionista o analista, esta calculadora DCF (2238HK) es su herramienta de referencia para una valoración precisa. Lleno de datos reales de Guangzhou Automobile Group Co., Ltd., puede ajustar los pronósticos y ver los efectos en tiempo real.
Discounted Cash Flow (DCF) - (USD MM)
| Year | AY1 2020 |
AY2 2021 |
AY3 2022 |
AY4 2023 |
AY5 2024 |
FY1 2025 |
FY2 2026 |
FY3 2027 |
FY4 2028 |
FY5 2029 |
|---|---|---|---|---|---|---|---|---|---|---|
| Revenue | 69,213.1 | 82,932.3 | 120,555.0 | 142,143.7 | 118,119.2 | 137,666.0 | 160,447.5 | 186,998.9 | 217,944.1 | 254,010.3 |
| Revenue Growth, % | 0 | 19.82 | 45.37 | 17.91 | -16.9 | 16.55 | 16.55 | 16.55 | 16.55 | 16.55 |
| EBITDA | 12,209.3 | 14,586.1 | 15,757.4 | 11,414.0 | 9,322.5 | 17,682.2 | 20,608.3 | 24,018.6 | 27,993.3 | 32,625.8 |
| EBITDA, % | 17.64 | 17.59 | 13.07 | 8.03 | 7.89 | 12.84 | 12.84 | 12.84 | 12.84 | 12.84 |
| Depreciation | 5,503.5 | 6,162.8 | 7,229.0 | 7,067.9 | 9,545.9 | 9,480.5 | 11,049.4 | 12,877.9 | 15,009.0 | 17,492.7 |
| Depreciation, % | 7.95 | 7.43 | 6 | 4.97 | 8.08 | 6.89 | 6.89 | 6.89 | 6.89 | 6.89 |
| EBIT | 6,705.8 | 8,423.3 | 8,528.4 | 4,346.1 | -223.4 | 8,201.7 | 9,558.9 | 11,140.7 | 12,984.4 | 15,133.0 |
| EBIT, % | 9.69 | 10.16 | 7.07 | 3.06 | -0.18909 | 5.96 | 5.96 | 5.96 | 5.96 | 5.96 |
| Total Cash | 32,980.9 | 29,875.7 | 47,938.8 | 61,385.9 | 59,378.0 | 59,718.4 | 69,600.8 | 81,118.6 | 94,542.3 | 110,187.5 |
| Total Cash, percent | .0 | .0 | .0 | .0 | .0 | .0 | .0 | .0 | .0 | .0 |
| Account Receivables | 12,528.3 | 14,038.4 | 15,624.6 | 10,319.1 | 8,480.2 | 17,188.5 | 20,032.9 | 23,348.0 | 27,211.7 | 31,714.8 |
| Account Receivables, % | 18.1 | 16.93 | 12.96 | 7.26 | 7.18 | 12.49 | 12.49 | 12.49 | 12.49 | 12.49 |
| Inventories | 7,256.5 | 8,888.7 | 13,547.2 | 18,323.6 | 17,192.9 | 16,488.6 | 19,217.2 | 22,397.3 | 26,103.7 | 30,423.4 |
| Inventories, % | 10.48 | 10.72 | 11.24 | 12.89 | 14.56 | 11.98 | 11.98 | 11.98 | 11.98 | 11.98 |
| Accounts Payable | 14,114.9 | 17,474.7 | 19,448.2 | 30,228.9 | 38,899.5 | 30,780.9 | 35,874.6 | 41,811.2 | 48,730.3 | 56,794.4 |
| Accounts Payable, % | 20.39 | 21.07 | 16.13 | 21.27 | 32.93 | 22.36 | 22.36 | 22.36 | 22.36 | 22.36 |
| Capital Expenditure | -7,217.0 | -6,841.6 | -8,781.9 | -12,686.6 | -11,900.5 | -12,379.4 | -14,428.0 | -16,815.6 | -19,598.3 | -22,841.5 |
| Capital Expenditure, % | -10.43 | -8.25 | -7.28 | -8.93 | -10.08 | -8.99 | -8.99 | -8.99 | -8.99 | -8.99 |
| Tax Rate, % | 213.28 | 213.28 | 213.28 | 213.28 | 213.28 | 213.28 | 213.28 | 213.28 | 213.28 | 213.28 |
| EBITAT | 7,024.6 | 8,537.4 | 9,215.4 | 5,460.9 | 253.0 | 6,561.3 | 7,647.1 | 8,912.6 | 10,387.5 | 12,106.4 |
| Depreciation | ||||||||||
| Changes in Account Receivables | ||||||||||
| Changes in Inventories | ||||||||||
| Changes in Accounts Payable | ||||||||||
| Capital Expenditure | ||||||||||
| UFCF | -358.8 | 8,076.1 | 3,391.3 | 11,152.0 | 9,538.6 | -12,460.1 | 3,789.3 | 4,416.3 | 5,147.2 | 5,998.9 |
| WACC, % | 5.22 | 5.22 | 5.22 | 5.22 | 3.51 | 4.88 | 4.88 | 4.88 | 4.88 | 4.88 |
| PV UFCF | ||||||||||
| SUM PV UFCF | 4,375.0 | |||||||||
| Long Term Growth Rate, % | 2.00 | |||||||||
| Free cash flow (T + 1) | 6,119 | |||||||||
| Terminal Value | 212,657 | |||||||||
| Present Terminal Value | 167,598 | |||||||||
| Enterprise Value | 171,973 | |||||||||
| Net Debt | -23,895 | |||||||||
| Equity Value | 195,869 | |||||||||
| Diluted Shares Outstanding, MM | 11,493 | |||||||||
| Equity Value Per Share | 17.04 |
What You Will Gain
- Authentic GAC Financial Data: Pre-loaded with Guangzhou Automobile Group’s historical and projected figures for accurate analysis.
- Completely Customizable Template: Easily adjust key inputs such as revenue growth, WACC, and EBITDA percentage.
- Instant Calculations: View the intrinsic value of GAC update immediately as you make adjustments.
- Professional Valuation Tool: Tailored for investors, analysts, and consultants aiming for precise DCF outcomes.
- Intuitive Design: An easy-to-navigate structure with clear instructions suitable for all skill levels.
Key Features
- Customizable Forecast Parameters: Adjust essential inputs such as sales growth, EBITDA percentage, and capital spending.
- Instant DCF Valuation: Quickly computes intrinsic value, net present value, and other financial metrics.
- High-Precision Accuracy: Utilizes Guangzhou Automobile Group's (2238HK) actual financial data for credible valuation results.
- Simplified Scenario Analysis: Effortlessly evaluate varying assumptions and analyze results side by side.
- Efficiency Booster: Remove the hassle of creating intricate valuation models from the ground up.
How It Operates
- Step 1: Download the Excel spreadsheet.
- Step 2: Examine the pre-filled data for Guangzhou Automobile Group Co., Ltd. (2238HK) including both historical and projected figures.
- Step 3: Modify the key assumptions provided in the yellow cells according to your analysis.
- Step 4: Observe the automatic updates reflecting the intrinsic value of Guangzhou Automobile Group Co., Ltd. (2238HK).
- Step 5: Utilize the results for your investment evaluations or reporting purposes.
Why Choose This Calculator for Guangzhou Automobile Group Co., Ltd. (2238HK)?
- All-in-One Tool: Combines DCF, WACC, and financial ratio analyses for comprehensive evaluations.
- Flexible Inputs: Easily modify yellow-highlighted fields to explore different financial scenarios.
- In-Depth Analysis: Automatically computes the intrinsic value and Net Present Value of Guangzhou Automobile Group.
- Preloaded Information: Access to historical and forecasted data ensures reliable starting points for analysis.
- Expert-Grade Quality: Perfectly suited for financial analysts, investors, and business consultants focused on (2238HK).
Who Should Use This Product?
- Investors: Evaluate the fair value of Guangzhou Automobile Group Co., Ltd. (2238HK) to inform your investment choices.
- CFOs: Utilize a top-tier DCF model for comprehensive financial reporting and analysis.
- Consultants: Seamlessly customize the template for client valuation reports.
- Entrepreneurs: Discover financial modeling techniques employed by leading automotive companies.
- Educators: Employ this tool to teach various valuation methodologies effectively.
Contents of the Template
- Pre-Filled Data: Offers Guangzhou Automobile Group Co., Ltd.'s historical financial data and projections.
- Discounted Cash Flow Model: An editable DCF valuation model featuring automatic calculations.
- Weighted Average Cost of Capital (WACC): A dedicated sheet for WACC calculations based on user-defined inputs.
- Key Financial Ratios: Evaluate Guangzhou Automobile's profitability, efficiency, and leverage.
- Customizable Inputs: Easily modify revenue growth rates, profit margins, and tax rates.
- User-Friendly Dashboard: Visual representations and tables displaying essential valuation results.
Disclaimer
All information, articles, and product details provided on this website are for general informational and educational purposes only. We do not claim any ownership over, nor do we intend to infringe upon, any trademarks, copyrights, logos, brand names, or other intellectual property mentioned or depicted on this site. Such intellectual property remains the property of its respective owners, and any references here are made solely for identification or informational purposes, without implying any affiliation, endorsement, or partnership.
We make no representations or warranties, express or implied, regarding the accuracy, completeness, or suitability of any content or products presented. Nothing on this website should be construed as legal, tax, investment, financial, medical, or other professional advice. In addition, no part of this site—including articles or product references—constitutes a solicitation, recommendation, endorsement, advertisement, or offer to buy or sell any securities, franchises, or other financial instruments, particularly in jurisdictions where such activity would be unlawful.
All content is of a general nature and may not address the specific circumstances of any individual or entity. It is not a substitute for professional advice or services. Any actions you take based on the information provided here are strictly at your own risk. You accept full responsibility for any decisions or outcomes arising from your use of this website and agree to release us from any liability in connection with your use of, or reliance upon, the content or products found herein.