
|
Prudential PLC (2378.HK) Valoración de DCF |
Completamente Editable: Adáptelo A Sus Necesidades En Excel O Sheets
Diseño Profesional: Plantillas Confiables Y Estándares De La Industria
Predeterminadas Para Un Uso Rápido Y Eficiente
Compatible con MAC / PC, completamente desbloqueado
No Se Necesita Experiencia; Fáciles De Seguir
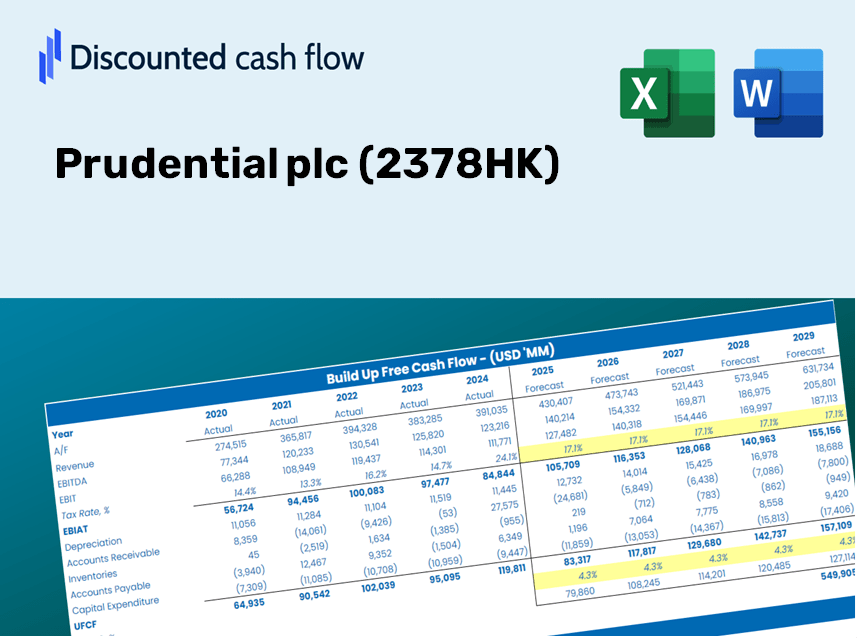
Prudential plc (2378.HK) Bundle
¡Descubra el verdadero valor de Prudential PLC (2378HK) con nuestra calculadora DCF de grado profesional! Ajuste los supuestos esenciales, explore varios escenarios y evalúe cómo los cambios afectan la valoración de PLC prudencial (2378HK), todo dentro de una plantilla de Excel conveniente.
Discounted Cash Flow (DCF) - (USD MM)
| Year | AY1 2020 |
AY2 2021 |
AY3 2022 |
AY4 2023 |
AY5 2024 |
FY1 2025 |
FY2 2026 |
FY3 2027 |
FY4 2028 |
FY5 2029 |
|---|---|---|---|---|---|---|---|---|---|---|
| Revenue | 370,737.4 | 271,044.3 | -282,172.4 | 122,430.2 | 83,246.4 | 29,366.1 | 10,359.2 | 3,654.3 | 1,289.1 | 454.7 |
| Revenue Growth, % | 0 | -26.89 | -204.11 | -143.39 | -32.01 | -64.72 | -64.72 | -64.72 | -64.72 | -64.72 |
| EBITDA | 35,205.1 | 30,725.2 | -4,531.0 | 31,287.7 | 29,999.0 | 4,935.2 | 1,741.0 | 614.1 | 216.6 | 76.4 |
| EBITDA, % | 9.5 | 11.34 | 1.61 | 25.56 | 36.04 | 16.81 | 16.81 | 16.81 | 16.81 | 16.81 |
| Depreciation | 2,229.7 | .0 | .0 | 5,359.5 | -1,953.6 | 154.6 | 54.5 | 19.2 | 6.8 | 2.4 |
| Depreciation, % | 0.60143 | 0 | 0 | 4.38 | -2.35 | 0.52646 | 0.52646 | 0.52646 | 0.52646 | 0.52646 |
| EBIT | 32,975.4 | 30,725.2 | -4,531.0 | 25,928.2 | 31,952.5 | 4,780.6 | 1,686.4 | 594.9 | 209.9 | 74.0 |
| EBIT, % | 8.89 | 11.34 | 1.61 | 21.18 | 38.38 | 16.28 | 16.28 | 16.28 | 16.28 | 16.28 |
| Total Cash | 450,557.4 | 73,335.4 | 18,502.6 | 16,262.7 | 25,007.7 | 9,621.7 | 3,394.2 | 1,197.3 | 422.4 | 149.0 |
| Total Cash, percent | .0 | .0 | .0 | .0 | .0 | .0 | .0 | .0 | .0 | .0 |
| Account Receivables | .0 | 29,497.8 | 28,505.7 | .0 | 22,624.5 | 1,642.1 | 579.3 | 204.3 | 72.1 | 25.4 |
| Account Receivables, % | 0 | 10.88 | -10.1 | 0 | 27.18 | 5.59 | 5.59 | 5.59 | 5.59 | 5.59 |
| Inventories | .0 | .0 | .0 | .0 | .0 | .0 | .0 | .0 | .0 | .0 |
| Inventories, % | 0 | 0 | 0 | 0 | 0 | 0 | 0 | 0 | 0 | 0 |
| Accounts Payable | 13,132.9 | 11,455.5 | 29,395.5 | .0 | .0 | -155.6 | -54.9 | -19.4 | -6.8 | -2.4 |
| Accounts Payable, % | 3.54 | 4.23 | -10.42 | 0 | 0 | -0.52976 | -0.52976 | -0.52976 | -0.52976 | -0.52976 |
| Capital Expenditure | -583.0 | -368.2 | -347.8 | -450.0 | -1,033.0 | -111.7 | -39.4 | -13.9 | -4.9 | -1.7 |
| Capital Expenditure, % | -0.15725 | -0.13585 | 0.12324 | -0.36759 | -1.24 | -0.38033 | -0.38033 | -0.38033 | -0.38033 | -0.38033 |
| Tax Rate, % | 22.62 | 22.62 | 22.62 | 22.62 | 22.62 | 22.62 | 22.62 | 22.62 | 22.62 | 22.62 |
| EBITAT | 24,017.1 | -23,445.7 | -7,096.0 | 21,031.9 | 24,724.5 | 3,167.9 | 1,117.5 | 394.2 | 139.1 | 49.1 |
| Depreciation | ||||||||||
| Changes in Account Receivables | ||||||||||
| Changes in Inventories | ||||||||||
| Changes in Accounts Payable | ||||||||||
| Capital Expenditure | ||||||||||
| UFCF | 38,796.7 | -54,989.2 | 11,488.4 | 25,051.5 | -886.6 | 24,037.7 | 2,296.2 | 810.0 | 285.7 | 100.8 |
| WACC, % | 8.37 | 7.99 | 8.51 | 8.41 | 8.39 | 8.33 | 8.33 | 8.33 | 8.33 | 8.33 |
| PV UFCF | ||||||||||
| SUM PV UFCF | 25,057.4 | |||||||||
| Long Term Growth Rate, % | 2.00 | |||||||||
| Free cash flow (T + 1) | 103 | |||||||||
| Terminal Value | 1,624 | |||||||||
| Present Terminal Value | 1,088 | |||||||||
| Enterprise Value | 26,145 | |||||||||
| Net Debt | 23,289 | |||||||||
| Equity Value | 2,856 | |||||||||
| Diluted Shares Outstanding, MM | 2,720 | |||||||||
| Equity Value Per Share | 1.05 |
Benefits You Will Receive
- Pre-Loaded Financial Model: Utilize Prudential plc’s actual data for accurate DCF valuation.
- Comprehensive Forecast Management: Modify revenue growth, profit margins, WACC, and other essential factors.
- Real-Time Calculations: Instantaneous updates allow you to view results as you adjust inputs.
- Professional-Grade Template: A polished Excel file prepared for high-quality valuation analyses.
- Flexible and Reusable: Designed for adaptability, enabling repeated application for in-depth projections.
Key Features
- Comprehensive Prudential Data: Pre-populated with Prudential plc’s historical financial performance and future projections.
- Customizable Parameters: Modify assumptions for revenue growth, profit margins, discount rates, tax implications, and capital investments.
- Dynamic Valuation Framework: Real-time updates to Net Present Value (NPV) and intrinsic value based on user-defined inputs.
- Scenario Analysis: Generate various forecasting scenarios to evaluate differing valuation results.
- User-Centric Interface: Intuitive and organized, catering to both experienced professionals and newcomers.
How It Works
- Download: Obtain the pre-formatted Excel file containing Prudential plc's (2378HK) financial data.
- Customize: Tailor your forecasts by modifying parameters such as revenue growth, EBITDA percentage, and WACC.
- Update Automatically: Watch as intrinsic value and NPV calculations refresh in real time.
- Test Scenarios: Generate various projections and instantly compare the results.
- Make Decisions: Leverage the valuation outcomes to inform your investment approach.
Why Select This Calculator for Prudential plc (2378HK)?
- User-Friendly Interface: Tailored for both novices and seasoned professionals.
- Customizable Inputs: Easily adjust parameters to suit your financial evaluation.
- Real-Time Updates: Instantly view changes in Prudential’s valuation as you modify inputs.
- Preconfigured Data: Comes loaded with Prudential’s actual financial details for swift analysis.
- Endorsed by Experts: Utilized by financial analysts and investors for informed decision-making.
Who Should Utilize This Product?
- Investors: Evaluate Prudential plc's (2378HK) valuation prior to making stock transactions.
- CFOs and Financial Analysts: Optimize valuation workflows and assess forecasts.
- Startup Founders: Understand the valuation methods used for large public entities like Prudential plc.
- Consultants: Provide clients with comprehensive valuation reports.
- Students and Educators: Leverage real-time data to practice and instruct on valuation strategies.
Contents of the Template
- Pre-Filled Data: Features Prudential plc's historical financial performance and future projections.
- Discounted Cash Flow Model: An editable DCF valuation model with automated calculations.
- Weighted Average Cost of Capital (WACC): A specific sheet for WACC computation based on user-defined inputs.
- Key Financial Ratios: Assess Prudential plc's profitability, efficiency, and leverage metrics.
- Customizable Inputs: Easily modify revenue growth, margins, and tax rates.
- Clear Dashboard: Visuals and tables that summarize essential valuation findings.
Disclaimer
All information, articles, and product details provided on this website are for general informational and educational purposes only. We do not claim any ownership over, nor do we intend to infringe upon, any trademarks, copyrights, logos, brand names, or other intellectual property mentioned or depicted on this site. Such intellectual property remains the property of its respective owners, and any references here are made solely for identification or informational purposes, without implying any affiliation, endorsement, or partnership.
We make no representations or warranties, express or implied, regarding the accuracy, completeness, or suitability of any content or products presented. Nothing on this website should be construed as legal, tax, investment, financial, medical, or other professional advice. In addition, no part of this site—including articles or product references—constitutes a solicitation, recommendation, endorsement, advertisement, or offer to buy or sell any securities, franchises, or other financial instruments, particularly in jurisdictions where such activity would be unlawful.
All content is of a general nature and may not address the specific circumstances of any individual or entity. It is not a substitute for professional advice or services. Any actions you take based on the information provided here are strictly at your own risk. You accept full responsibility for any decisions or outcomes arising from your use of this website and agree to release us from any liability in connection with your use of, or reliance upon, the content or products found herein.