
|
Askul Corporation (2678.T) Valoración de DCF |
Completamente Editable: Adáptelo A Sus Necesidades En Excel O Sheets
Diseño Profesional: Plantillas Confiables Y Estándares De La Industria
Predeterminadas Para Un Uso Rápido Y Eficiente
Compatible con MAC / PC, completamente desbloqueado
No Se Necesita Experiencia; Fáciles De Seguir
ASKUL Corporation (2678.T) Bundle
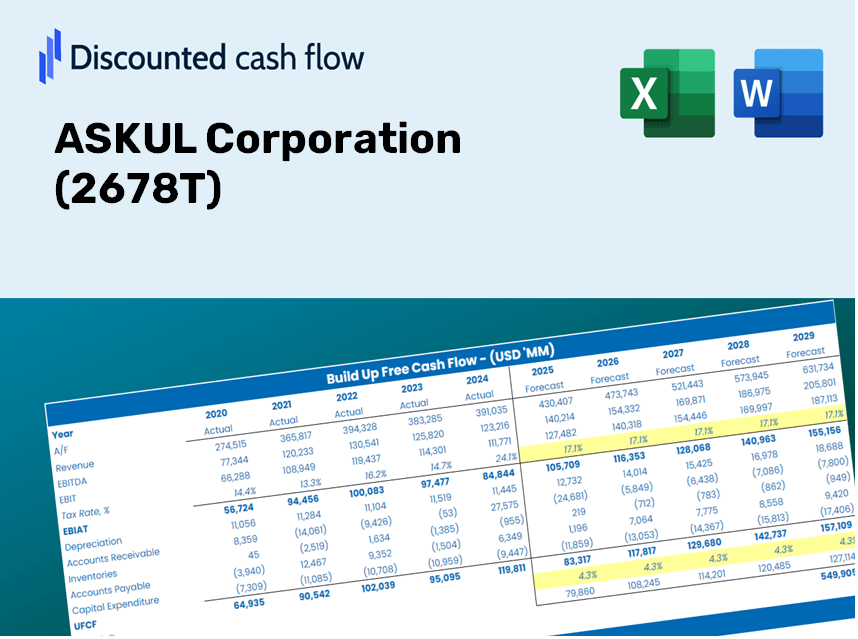
Diseñada para la precisión, nuestra calculadora DCF (2678T) le permite evaluar la valoración de Askul Corporation utilizando datos financieros del mundo real, ofreciendo una flexibilidad completa para modificar todos los parámetros esenciales para mejorar las proyecciones.
Benefits You Will Receive
- Comprehensive ASKUL Financial Data: Pre-loaded with historical and projected figures specific to ASKUL for in-depth analysis.
- Customizable Template: Easily adjust key metrics such as revenue growth, WACC, and EBITDA percentage.
- Instant Calculations: Observe real-time updates on ASKUL's intrinsic value as you modify inputs.
- Professional Valuation Resource: Tailored for investors, analysts, and consultants aiming for precise DCF outcomes.
- Intuitive Interface: Designed with a straightforward layout and clear guidelines, suitable for all skill levels.
Key Features
- Pre-Loaded Data: ASKUL Corporation’s historical financial reports and pre-filled projections.
- Fully Adjustable Inputs: Modify WACC, tax rates, revenue growth, and EBITDA margins as needed.
- Instant Results: View the intrinsic value of ASKUL Corporation recalculated in real time.
- Clear Visual Outputs: Dashboard charts illustrate valuation results and essential metrics.
- Built for Accuracy: A professional tool designed for analysts, investors, and finance professionals.
How It Functions
- 1. Access the Template: Download and open the Excel file containing ASKUL Corporation's (2678T) prepopulated data.
- 2. Modify Assumptions: Adjust crucial inputs such as growth rates, WACC, and capital expenditures as needed.
- 3. View Results in Real-Time: The DCF model automatically calculates intrinsic value and NPV based on your inputs.
- 4. Analyze Scenarios: Evaluate various forecasts to explore different valuation scenarios.
- 5. Present with Confidence: Share professional valuation insights to inform your investment decisions.
Why Opt for the ASKUL Corporation ([2678T]) Calculator?
- Streamline Your Process: Skip the hassle of building a DCF model from the ground up – it's immediately available for your use.
- Enhance Precision: Dependable financial data and formulas help minimize errors in your valuation assessments.
- Completely Customizable: Adjust the model to align with your specific assumptions and forecasts.
- User-Friendly: Intuitive charts and outputs facilitate straightforward analysis of the results.
- Endorsed by Professionals: Crafted for industry experts who prioritize accuracy and simplicity.
Who Can Benefit from This Product?
- Finance Students: Master valuation techniques by applying them to real-world data.
- Academics: Enhance your curriculum or research by integrating professional valuation models.
- Investors: Evaluate your assumptions and scrutinize valuation scenarios for ASKUL Corporation (2678T).
- Analysts: Improve your efficiency with a customizable, ready-to-use DCF model.
- Small Business Owners: Discover how major public companies like ASKUL Corporation (2678T) are evaluated.
Contents of the Template
- Pre-Filled DCF Model: ASKUL Corporation's financial data preloaded for immediate analysis.
- WACC Calculator: Comprehensive calculations for the Weighted Average Cost of Capital.
- Financial Ratios: Assess ASKUL Corporation’s profitability, leverage, and operational efficiency.
- Editable Inputs: Customize assumptions such as growth rates, profit margins, and capital expenditures to match your scenarios.
- Financial Statements: Annual and quarterly reports to facilitate in-depth analysis.
- Interactive Dashboard: Effortlessly visualize key valuation metrics and results.
Disclaimer
All information, articles, and product details provided on this website are for general informational and educational purposes only. We do not claim any ownership over, nor do we intend to infringe upon, any trademarks, copyrights, logos, brand names, or other intellectual property mentioned or depicted on this site. Such intellectual property remains the property of its respective owners, and any references here are made solely for identification or informational purposes, without implying any affiliation, endorsement, or partnership.
We make no representations or warranties, express or implied, regarding the accuracy, completeness, or suitability of any content or products presented. Nothing on this website should be construed as legal, tax, investment, financial, medical, or other professional advice. In addition, no part of this site—including articles or product references—constitutes a solicitation, recommendation, endorsement, advertisement, or offer to buy or sell any securities, franchises, or other financial instruments, particularly in jurisdictions where such activity would be unlawful.
All content is of a general nature and may not address the specific circumstances of any individual or entity. It is not a substitute for professional advice or services. Any actions you take based on the information provided here are strictly at your own risk. You accept full responsibility for any decisions or outcomes arising from your use of this website and agree to release us from any liability in connection with your use of, or reliance upon, the content or products found herein.