
|
Alfresa Holdings Corporation (2784.T) Valoración de DCF |
Completamente Editable: Adáptelo A Sus Necesidades En Excel O Sheets
Diseño Profesional: Plantillas Confiables Y Estándares De La Industria
Predeterminadas Para Un Uso Rápido Y Eficiente
Compatible con MAC / PC, completamente desbloqueado
No Se Necesita Experiencia; Fáciles De Seguir
Alfresa Holdings Corporation (2784.T) Bundle
Ingementada para su precisión, nuestra calculadora DCF (2784T) le permite evaluar la valoración de Alfresa Holdings Corporation utilizando datos financieros del mundo real, ofreciendo una flexibilidad completa para modificar todos los parámetros esenciales para las proyecciones mejoradas.
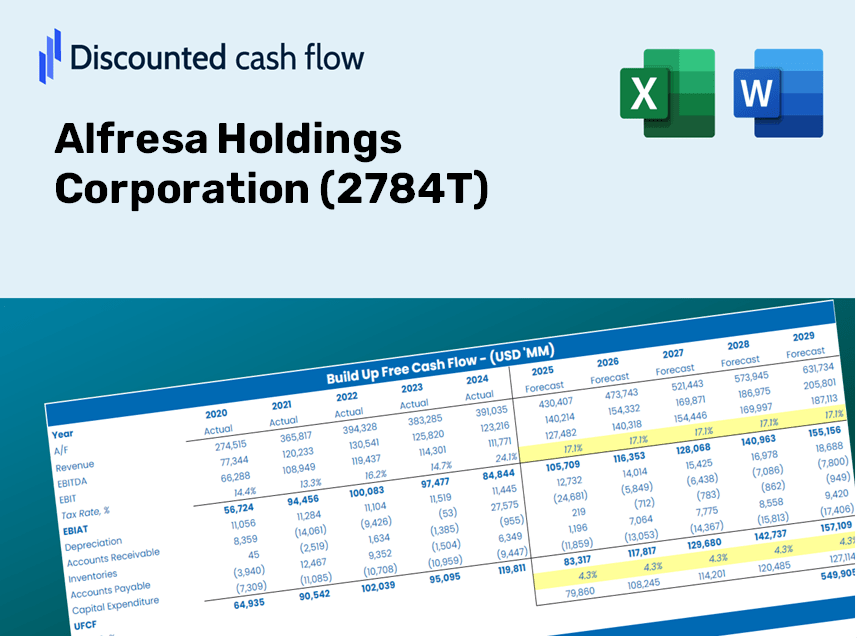
Discounted Cash Flow (DCF) - (USD MM)
| Year | AY1 2021 |
AY2 2022 |
AY3 2023 |
AY4 2024 |
AY5 2025 |
FY1 2026 |
FY2 2027 |
FY3 2028 |
FY4 2029 |
FY5 2030 |
|---|---|---|---|---|---|---|---|---|---|---|
| Revenue | 2,603,263.0 | 2,585,643.0 | 2,696,069.0 | 2,858,500.0 | 2,961,051.0 | 3,058,811.6 | 3,159,799.9 | 3,264,122.4 | 3,371,889.1 | 3,483,213.7 |
| Revenue Growth, % | 0 | -0.67684 | 4.27 | 6.02 | 3.59 | 3.3 | 3.3 | 3.3 | 3.3 | 3.3 |
| EBITDA | 48,484.0 | 61,077.0 | 51,957.0 | 57,442.0 | 54,566.0 | 61,200.9 | 63,221.5 | 65,308.8 | 67,465.0 | 69,692.4 |
| EBITDA, % | 1.86 | 2.36 | 1.93 | 2.01 | 1.84 | 2 | 2 | 2 | 2 | 2 |
| Depreciation | 11,868.0 | 12,824.0 | 13,302.0 | 13,514.0 | 14,923.0 | 14,816.8 | 15,306.0 | 15,811.3 | 16,333.3 | 16,872.6 |
| Depreciation, % | 0.45589 | 0.49597 | 0.49338 | 0.47277 | 0.50398 | 0.4844 | 0.4844 | 0.4844 | 0.4844 | 0.4844 |
| EBIT | 36,616.0 | 48,253.0 | 38,655.0 | 43,928.0 | 39,643.0 | 46,384.1 | 47,915.5 | 49,497.5 | 51,131.7 | 52,819.8 |
| EBIT, % | 1.41 | 1.87 | 1.43 | 1.54 | 1.34 | 1.52 | 1.52 | 1.52 | 1.52 | 1.52 |
| Total Cash | 170,336.0 | 180,436.0 | 160,122.0 | 213,756.0 | 177,085.0 | 201,386.2 | 208,035.1 | 214,903.5 | 221,998.6 | 229,328.0 |
| Total Cash, percent | .0 | .0 | .0 | .0 | .0 | .0 | .0 | .0 | .0 | .0 |
| Account Receivables | 591,619.0 | 679,232.0 | 705,771.0 | 733,288.0 | 729,815.0 | 767,598.1 | 792,940.8 | 819,120.1 | 846,163.8 | 874,100.3 |
| Account Receivables, % | 22.73 | 26.27 | 26.18 | 25.65 | 24.65 | 25.09 | 25.09 | 25.09 | 25.09 | 25.09 |
| Inventories | 148,048.0 | 146,889.0 | 152,790.0 | 156,377.0 | 167,669.0 | 172,322.3 | 178,011.6 | 183,888.8 | 189,960.0 | 196,231.6 |
| Inventories, % | 5.69 | 5.68 | 5.67 | 5.47 | 5.66 | 5.63 | 5.63 | 5.63 | 5.63 | 5.63 |
| Accounts Payable | 753,857.0 | 755,250.0 | 780,343.0 | 855,328.0 | 834,925.0 | 888,465.1 | 917,798.3 | 948,099.9 | 979,401.9 | 1,011,737.3 |
| Accounts Payable, % | 28.96 | 29.21 | 28.94 | 29.92 | 28.2 | 29.05 | 29.05 | 29.05 | 29.05 | 29.05 |
| Capital Expenditure | -18,211.0 | -16,988.0 | -25,465.0 | -15,328.0 | -16,508.0 | -20,768.2 | -21,453.8 | -22,162.2 | -22,893.9 | -23,649.7 |
| Capital Expenditure, % | -0.69955 | -0.65701 | -0.94452 | -0.53623 | -0.5575 | -0.67896 | -0.67896 | -0.67896 | -0.67896 | -0.67896 |
| Tax Rate, % | 30.41 | 30.41 | 30.41 | 30.41 | 30.41 | 30.41 | 30.41 | 30.41 | 30.41 | 30.41 |
| EBITAT | 24,558.0 | 32,230.8 | 25,828.8 | 29,647.8 | 27,587.6 | 31,333.9 | 32,368.4 | 33,437.0 | 34,541.0 | 35,681.4 |
| Depreciation | ||||||||||
| Changes in Account Receivables | ||||||||||
| Changes in Inventories | ||||||||||
| Changes in Accounts Payable | ||||||||||
| Capital Expenditure | ||||||||||
| UFCF | 32,405.0 | -56,994.2 | 6,318.8 | 71,714.8 | -2,219.4 | 36,486.2 | 24,521.7 | 25,331.3 | 26,167.6 | 27,031.5 |
| WACC, % | 4.36 | 4.36 | 4.36 | 4.36 | 4.37 | 4.36 | 4.36 | 4.36 | 4.36 | 4.36 |
| PV UFCF | ||||||||||
| SUM PV UFCF | 123,657.5 | |||||||||
| Long Term Growth Rate, % | 2.00 | |||||||||
| Free cash flow (T + 1) | 27,572 | |||||||||
| Terminal Value | 1,167,474 | |||||||||
| Present Terminal Value | 943,065 | |||||||||
| Enterprise Value | 1,066,723 | |||||||||
| Net Debt | -141,540 | |||||||||
| Equity Value | 1,208,263 | |||||||||
| Diluted Shares Outstanding, MM | 186 | |||||||||
| Equity Value Per Share | 6,508.74 |
What You Will Receive
- Authentic Alfresa Financial Data: Pre-loaded with Alfresa’s historical and forecasted data for accurate analysis.
- Completely Customizable Template: Easily adjust essential parameters like revenue growth, WACC, and EBITDA %.
- Instant Calculations: View Alfresa's intrinsic value update immediately as you input changes.
- Professional Valuation Tool: Tailored for investors, analysts, and consultants aiming for precise DCF outcomes.
- User-Friendly Interface: Intuitive layout and clear guidance suitable for all skill levels.
Key Features
- Genuine Alfresa Financials: Gain access to precise pre-loaded historical data and forecasts.
- Adjustable Forecast Assumptions: Modify yellow-highlighted fields such as WACC, growth rates, and profit margins.
- Real-time Calculations: Automatic updates for DCF, Net Present Value (NPV), and cash flow assessments.
- Interactive Dashboard: Visual charts and summaries for easy interpretation of your valuation findings.
- Designed for All Skill Levels: A straightforward and intuitive layout tailored for investors, CFOs, and consultants.
How It Functions
- Download: Obtain the pre-built Excel file featuring Alfresa Holdings Corporation’s financial data.
- Customize: Tailor forecasts such as revenue growth, EBITDA %, and WACC to suit your analysis.
- Update Automatically: Watch as intrinsic value and NPV calculations refresh in real-time.
- Test Scenarios: Generate various projections and compare results instantly.
- Make Decisions: Leverage the valuation outcomes to inform your investment strategies.
Why Choose This Calculator for Alfresa Holdings Corporation (2784T)?
- All-in-One Solution: Features DCF, WACC, and financial ratio analyses combined into a single tool.
- Flexible Inputs: Modify the highlighted cells to explore different scenarios.
- In-Depth Analysis: Automatically computes Alfresa's intrinsic value and Net Present Value.
- Preloaded Metrics: Access both historical and projected data for reliable foundations.
- High-Quality Standards: Perfect for financial analysts, investors, and business advisors.
Who Should Use This Product?
- Investors: Accurately assess the fair value of Alfresa Holdings Corporation (2784T) before making investment decisions.
- CFOs: Utilize a professional-grade DCF model for financial reporting and analysis for Alfresa Holdings Corporation (2784T).
- Consultants: Efficiently customize the template for valuation reports catering to clients interested in Alfresa Holdings Corporation (2784T).
- Entrepreneurs: Discover financial modeling techniques employed by leading companies like Alfresa Holdings Corporation (2784T).
- Educators: Implement this resource as a teaching aid to illustrate valuation methodologies related to Alfresa Holdings Corporation (2784T).
Contents of the Template
- Operating and Balance Sheet Data: Pre-filled historical data and forecasts for Alfresa Holdings Corporation (2784T), covering revenue, EBITDA, EBIT, and capital expenditures.
- WACC Calculation: A dedicated sheet for calculating the Weighted Average Cost of Capital (WACC), featuring parameters such as Beta, risk-free rate, and share price.
- DCF Valuation (Unlevered and Levered): Customizable Discounted Cash Flow models that display intrinsic value along with comprehensive calculations.
- Financial Statements: Pre-loaded financial statements (both annual and quarterly) to facilitate thorough analysis.
- Key Ratios: Includes essential profitability, leverage, and efficiency ratios for Alfresa Holdings Corporation (2784T).
- Dashboard and Charts: A visual overview of valuation outputs and assumptions, designed to simplify result analysis.
Disclaimer
All information, articles, and product details provided on this website are for general informational and educational purposes only. We do not claim any ownership over, nor do we intend to infringe upon, any trademarks, copyrights, logos, brand names, or other intellectual property mentioned or depicted on this site. Such intellectual property remains the property of its respective owners, and any references here are made solely for identification or informational purposes, without implying any affiliation, endorsement, or partnership.
We make no representations or warranties, express or implied, regarding the accuracy, completeness, or suitability of any content or products presented. Nothing on this website should be construed as legal, tax, investment, financial, medical, or other professional advice. In addition, no part of this site—including articles or product references—constitutes a solicitation, recommendation, endorsement, advertisement, or offer to buy or sell any securities, franchises, or other financial instruments, particularly in jurisdictions where such activity would be unlawful.
All content is of a general nature and may not address the specific circumstances of any individual or entity. It is not a substitute for professional advice or services. Any actions you take based on the information provided here are strictly at your own risk. You accept full responsibility for any decisions or outcomes arising from your use of this website and agree to release us from any liability in connection with your use of, or reliance upon, the content or products found herein.