
|
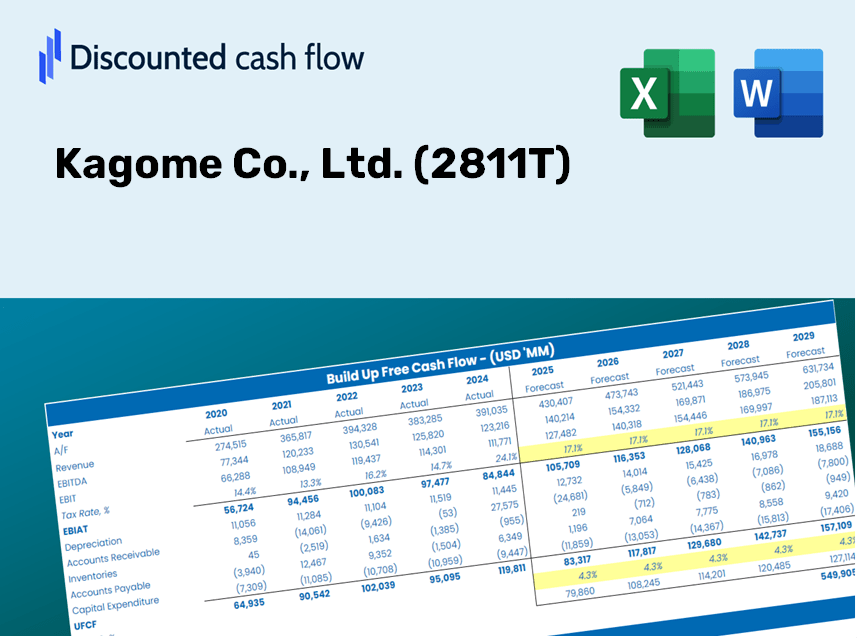
Kagome Co., Ltd. (2811.T) Valoración de DCF |
Completamente Editable: Adáptelo A Sus Necesidades En Excel O Sheets
Diseño Profesional: Plantillas Confiables Y Estándares De La Industria
Predeterminadas Para Un Uso Rápido Y Eficiente
Compatible con MAC / PC, completamente desbloqueado
No Se Necesita Experiencia; Fáciles De Seguir
Kagome Co., Ltd. (2811.T) Bundle
¡Evalúe la perspectiva financiera de Kagome Co., Ltd. como un experto! Esta calculadora DCF (2811T) proporciona datos financieros prejuficios y ofrece una flexibilidad completa para modificar el crecimiento de los ingresos, WACC, los márgenes y otros supuestos esenciales para alinearse con sus proyecciones.
What You Will Receive
- Authentic Kagome Financial Data: Pre-populated with Kagome's historical and forecast data for accurate assessments.
- Completely Customizable Template: Easily adjust key variables such as revenue growth, WACC, and EBITDA margin.
- Instantaneous Calculations: Observe real-time updates of Kagome's intrinsic value as you modify inputs.
- Expert Valuation Tool: Tailored for investors, analysts, and consultants aiming for precise DCF outcomes.
- Intuitive Design: Clean layout and straightforward instructions suitable for all skill levels.
Key Features
- Authentic Kagome Data: Pre-loaded with Kagome Co., Ltd.’s historical financial performance and future forecasts.
- Customizable Parameters: Modify growth rates, profit margins, discount rates, tax percentages, and capital investments.
- Adaptive Valuation Model: Instant updates to Net Present Value (NPV) and intrinsic worth based on your adjustments.
- Scenario Analysis: Develop various forecasting scenarios to explore different valuation results.
- Intuitive Interface: Clean, organized, and tailored for both experienced professionals and newcomers.
How It Works
- Step 1: Download the prebuilt Excel template featuring Kagome Co., Ltd.'s (2811T) data.
- Step 2: Navigate through the pre-filled sheets to understand the essential metrics.
- Step 3: Modify forecasts and assumptions in the editable yellow cells (WACC, growth, margins).
- Step 4: Instantly view the updated results, including Kagome Co., Ltd.'s (2811T) intrinsic value.
- Step 5: Utilize the outputs to make informed investment decisions or create reports.
Why Opt for This Calculator?
- User-Friendly Design: Crafted for both novices and experienced users.
- Customizable Inputs: Effortlessly adjust parameters to tailor your analysis.
- Real-Time Updates: Monitor immediate shifts in Kagome Co., Ltd. (2811T)'s valuation as you tweak inputs.
- Pre-Configured: Loaded with Kagome's actual financial data for swift assessments.
- Endorsed by Experts: Trusted by investors and analysts for making informed decisions.
Who Can Benefit from Kagome Co., Ltd. (2811T)?
- Investors: Make informed investment choices with a reliable valuation analysis.
- Financial Analysts: Streamline your workflow with a customizable DCF model at your fingertips.
- Consultants: Effortlessly modify the template for impactful client presentations or detailed reports.
- Finance Enthusiasts: Enhance your knowledge of valuation methods through practical, real-life scenarios.
- Educators and Students: Utilize this resource as a hands-on learning aid in finance-oriented courses.
Contents of the Template
- Preloaded Kagome Data: Historical and projected financial metrics, including revenue, EBIT, and capital expenditures.
- DCF and WACC Models: Advanced spreadsheets for determining intrinsic value and Weighted Average Cost of Capital.
- Editable Inputs: Yellow-highlighted fields for modifying revenue growth, tax rates, and discount rates.
- Financial Statements: Detailed annual and quarterly financial reports for in-depth analysis.
- Key Ratios: Profitability, leverage, and efficiency ratios to assess performance.
- Dashboard and Charts: Visual representations of valuation results and underlying assumptions.
Disclaimer
All information, articles, and product details provided on this website are for general informational and educational purposes only. We do not claim any ownership over, nor do we intend to infringe upon, any trademarks, copyrights, logos, brand names, or other intellectual property mentioned or depicted on this site. Such intellectual property remains the property of its respective owners, and any references here are made solely for identification or informational purposes, without implying any affiliation, endorsement, or partnership.
We make no representations or warranties, express or implied, regarding the accuracy, completeness, or suitability of any content or products presented. Nothing on this website should be construed as legal, tax, investment, financial, medical, or other professional advice. In addition, no part of this site—including articles or product references—constitutes a solicitation, recommendation, endorsement, advertisement, or offer to buy or sell any securities, franchises, or other financial instruments, particularly in jurisdictions where such activity would be unlawful.
All content is of a general nature and may not address the specific circumstances of any individual or entity. It is not a substitute for professional advice or services. Any actions you take based on the information provided here are strictly at your own risk. You accept full responsibility for any decisions or outcomes arising from your use of this website and agree to release us from any liability in connection with your use of, or reliance upon, the content or products found herein.