
|
Greentown Service Group Co. Ltd. (2869.hk) Valoración de DCF |
Completamente Editable: Adáptelo A Sus Necesidades En Excel O Sheets
Diseño Profesional: Plantillas Confiables Y Estándares De La Industria
Predeterminadas Para Un Uso Rápido Y Eficiente
Compatible con MAC / PC, completamente desbloqueado
No Se Necesita Experiencia; Fáciles De Seguir
Greentown Service Group Co. Ltd. (2869.HK) Bundle
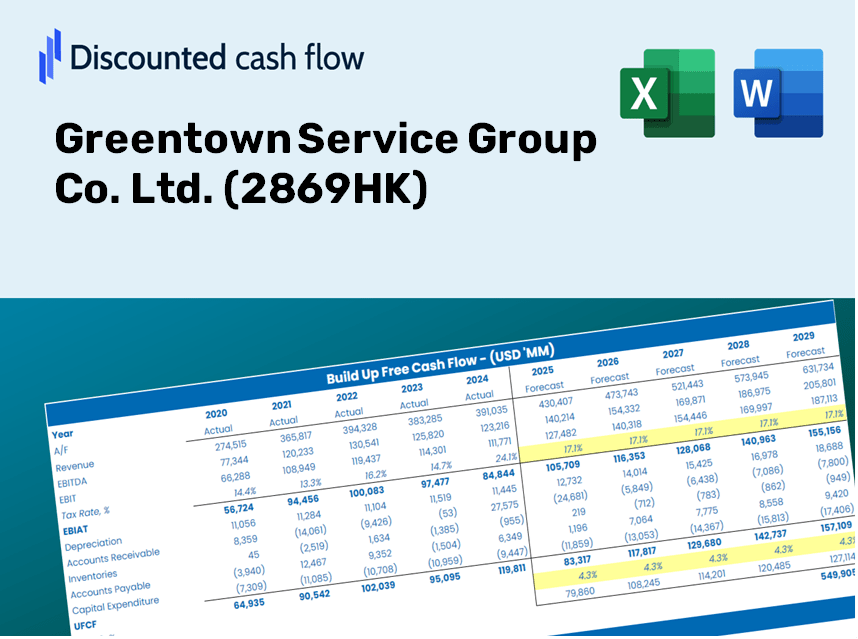
¡Obtenga información sobre su análisis de valoración de Greentown Service Group Co. Ltd. (2869HK) utilizando nuestra sofisticada calculadora DCF! Prelabastado con datos reales (2869HK), esta plantilla de Excel le permite ajustar los pronósticos y supuestos para un cálculo preciso del valor intrínseco de Greentown Service Group Co. Ltd.
Discounted Cash Flow (DCF) - (USD MM)
| Year | AY1 2020 |
AY2 2021 |
AY3 2022 |
AY4 2023 |
AY5 2024 |
FY1 2025 |
FY2 2026 |
FY3 2027 |
FY4 2028 |
FY5 2029 |
|---|---|---|---|---|---|---|---|---|---|---|
| Revenue | 11,049.5 | 13,739.8 | 16,243.9 | 19,017.8 | 19,564.7 | 20,376.2 | 21,221.3 | 22,101.5 | 23,018.2 | 23,973.0 |
| Revenue Growth, % | 0 | 24.35 | 18.23 | 17.08 | 2.88 | 4.15 | 4.15 | 4.15 | 4.15 | 4.15 |
| EBITDA | 1,061.4 | 1,342.4 | 1,142.9 | 1,678.5 | 1,532.6 | 1,755.3 | 1,828.1 | 1,903.9 | 1,982.9 | 2,065.1 |
| EBITDA, % | 9.61 | 9.77 | 7.04 | 8.83 | 7.83 | 8.61 | 8.61 | 8.61 | 8.61 | 8.61 |
| Depreciation | 141.0 | 198.3 | 242.1 | 529.8 | 292.8 | 346.1 | 360.4 | 375.4 | 391.0 | 407.2 |
| Depreciation, % | 1.28 | 1.44 | 1.49 | 2.79 | 1.5 | 1.7 | 1.7 | 1.7 | 1.7 | 1.7 |
| EBIT | 920.4 | 1,144.0 | 900.8 | 1,148.7 | 1,239.8 | 1,409.2 | 1,467.6 | 1,528.5 | 1,591.9 | 1,657.9 |
| EBIT, % | 8.33 | 8.33 | 5.55 | 6.04 | 6.34 | 6.92 | 6.92 | 6.92 | 6.92 | 6.92 |
| Total Cash | 6,549.6 | 6,020.9 | 5,538.5 | 6,221.2 | 6,328.4 | 8,242.2 | 8,584.1 | 8,940.1 | 9,310.9 | 9,697.1 |
| Total Cash, percent | .0 | .0 | .0 | .0 | .0 | .0 | .0 | .0 | .0 | .0 |
| Account Receivables | 1,382.7 | 2,345.1 | 3,845.2 | 4,663.1 | 5,664.2 | 4,349.3 | 4,529.7 | 4,717.5 | 4,913.2 | 5,117.0 |
| Account Receivables, % | 12.51 | 17.07 | 23.67 | 24.52 | 28.95 | 21.34 | 21.34 | 21.34 | 21.34 | 21.34 |
| Inventories | 377.8 | 474.6 | 623.5 | 736.7 | 653.8 | 730.6 | 760.9 | 792.4 | 825.3 | 859.5 |
| Inventories, % | 3.42 | 3.45 | 3.84 | 3.87 | 3.34 | 3.59 | 3.59 | 3.59 | 3.59 | 3.59 |
| Accounts Payable | 1,037.9 | 1,367.1 | 2,365.6 | 2,279.2 | 2,429.3 | 2,376.2 | 2,474.7 | 2,577.4 | 2,684.3 | 2,795.6 |
| Accounts Payable, % | 9.39 | 9.95 | 14.56 | 11.98 | 12.42 | 11.66 | 11.66 | 11.66 | 11.66 | 11.66 |
| Capital Expenditure | -380.0 | -447.7 | -496.2 | -549.9 | -352.0 | -588.6 | -613.0 | -638.4 | -664.9 | -692.5 |
| Capital Expenditure, % | -3.44 | -3.26 | -3.05 | -2.89 | -1.8 | -2.89 | -2.89 | -2.89 | -2.89 | -2.89 |
| Tax Rate, % | 26.66 | 26.66 | 26.66 | 26.66 | 26.66 | 26.66 | 26.66 | 26.66 | 26.66 | 26.66 |
| EBITAT | 651.9 | 812.9 | 570.9 | 715.2 | 909.3 | 960.7 | 1,000.5 | 1,042.0 | 1,085.2 | 1,130.2 |
| Depreciation | ||||||||||
| Changes in Account Receivables | ||||||||||
| Changes in Inventories | ||||||||||
| Changes in Accounts Payable | ||||||||||
| Capital Expenditure | ||||||||||
| UFCF | -309.7 | -166.4 | -333.7 | -322.4 | 82.1 | 1,903.2 | 635.8 | 662.2 | 689.7 | 718.3 |
| WACC, % | 7.28 | 7.28 | 7.26 | 7.26 | 7.29 | 7.27 | 7.27 | 7.27 | 7.27 | 7.27 |
| PV UFCF | ||||||||||
| SUM PV UFCF | 3,889.4 | |||||||||
| Long Term Growth Rate, % | 4.00 | |||||||||
| Free cash flow (T + 1) | 747 | |||||||||
| Terminal Value | 22,812 | |||||||||
| Present Terminal Value | 16,057 | |||||||||
| Enterprise Value | 19,947 | |||||||||
| Net Debt | -4,429 | |||||||||
| Equity Value | 24,375 | |||||||||
| Diluted Shares Outstanding, MM | 3,164 | |||||||||
| Equity Value Per Share | 7.70 |
What You Will Receive
- Authentic Greentown Data: Comprehensive financials – from revenue to EBIT – derived from actual and projected metrics.
- Complete Customization: Modify all essential parameters (highlighted cells) such as WACC, growth %, and tax rates.
- Immediate Valuation Adjustments: Automatic recalculations to assess the effects of changes on Greentown's fair value.
- Adaptable Excel Template: Designed for swift modifications, scenario analysis, and in-depth forecasts.
- Efficient and Precise: Eliminate the need to create models from the ground up while ensuring accuracy and adaptability.
Key Features
- Authentic Financial Data for Greentown: Gain access to reliable historical data and future forecasts customized for Greentown Service Group Co. Ltd. (2869HK).
- Adjustable Forecast Parameters: Modify highlighted fields such as WACC, growth rates, and profit margins to suit your analysis.
- Real-Time Calculations: Enjoy automatic updates to DCF, Net Present Value (NPV), and cash flow evaluations.
- Interactive Visual Dashboard: Utilize intuitive charts and summaries to effectively visualize your valuation outcomes.
- Designed for All Skill Levels: A straightforward and user-friendly platform tailored for investors, CFOs, and consultants alike.
How It Functions
- Step 1: Download the Excel file.
- Step 2: Examine Greentown Service Group Co. Ltd.'s pre-filled financial data and projections.
- Step 3: Adjust key parameters such as revenue growth, WACC, and tax rates (highlighted cells).
- Step 4: Observe the DCF model update in real-time as you modify your assumptions.
- Step 5: Evaluate the results and leverage them for your investment strategies.
Why Opt for Greentown Service Group Co. Ltd. (2869HK) Calculator?
- Precision: Utilizes authentic Greentown financial data to ensure reliable results.
- Versatility: Built for users to effortlessly adjust and experiment with various inputs.
- Efficiency: Avoid the complexities of constructing a financial model from the ground up.
- Expert-Level: Crafted with the accuracy and functionality typically found at the CFO level.
- Intuitive Design: Simple to navigate, even for those lacking extensive financial modeling skills.
Who Can Benefit from Greentown Service Group Co. Ltd. (2869HK)?
- Investors: Make informed choices with a reliable valuation tool tailored for the real estate services sector.
- Financial Analysts: Enhance efficiency with a customizable DCF model designed specifically for Greentown’s financials.
- Consultants: Easily modify templates for impactful client presentations or detailed reports regarding Greentown’s performance.
- Finance Enthusiasts: Expand your insight into valuation methodologies through practical applications related to Greentown’s operations.
- Educators and Students: Leverage this resource as a hands-on learning aid in real estate financing and valuation studies.
Contents of the Template
- Historical Data: A comprehensive overview of Greentown Service Group Co. Ltd.'s past financial performance and baseline forecasts.
- DCF and Levered DCF Models: Detailed frameworks for calculating the intrinsic value of Greentown Service Group Co. Ltd. (2869HK).
- WACC Sheet: Pre-configured calculations for the Weighted Average Cost of Capital.
- Editable Inputs: Adjust key variables such as growth rates, EBITDA %, and CAPEX assumptions as needed.
- Quarterly and Annual Statements: A thorough analysis of Greentown Service Group Co. Ltd.'s financial statements.
- Interactive Dashboard: Dynamically visualize valuation results and projections.
Disclaimer
All information, articles, and product details provided on this website are for general informational and educational purposes only. We do not claim any ownership over, nor do we intend to infringe upon, any trademarks, copyrights, logos, brand names, or other intellectual property mentioned or depicted on this site. Such intellectual property remains the property of its respective owners, and any references here are made solely for identification or informational purposes, without implying any affiliation, endorsement, or partnership.
We make no representations or warranties, express or implied, regarding the accuracy, completeness, or suitability of any content or products presented. Nothing on this website should be construed as legal, tax, investment, financial, medical, or other professional advice. In addition, no part of this site—including articles or product references—constitutes a solicitation, recommendation, endorsement, advertisement, or offer to buy or sell any securities, franchises, or other financial instruments, particularly in jurisdictions where such activity would be unlawful.
All content is of a general nature and may not address the specific circumstances of any individual or entity. It is not a substitute for professional advice or services. Any actions you take based on the information provided here are strictly at your own risk. You accept full responsibility for any decisions or outcomes arising from your use of this website and agree to release us from any liability in connection with your use of, or reliance upon, the content or products found herein.