
|
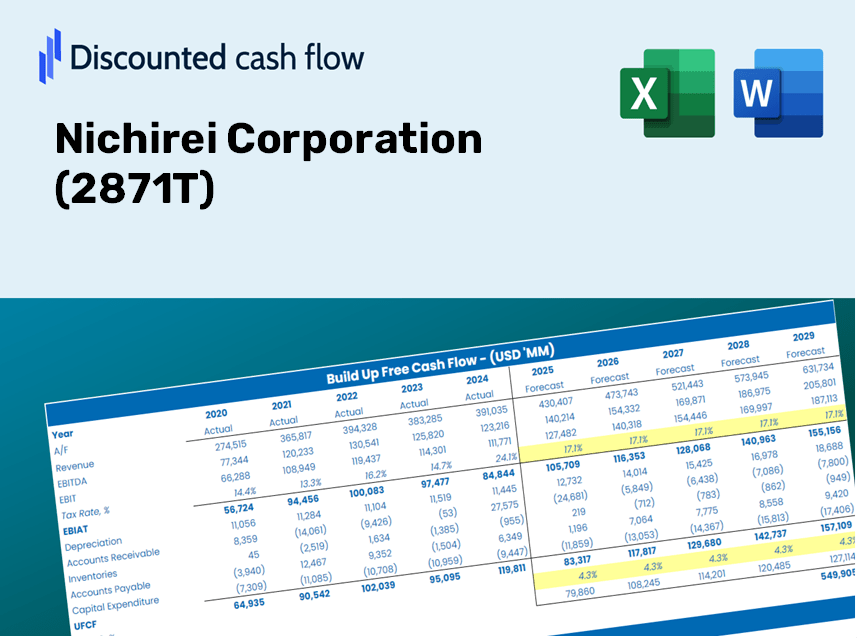
Nichirei Corporation (2871.T) Valoración de DCF |
Completamente Editable: Adáptelo A Sus Necesidades En Excel O Sheets
Diseño Profesional: Plantillas Confiables Y Estándares De La Industria
Predeterminadas Para Un Uso Rápido Y Eficiente
Compatible con MAC / PC, completamente desbloqueado
No Se Necesita Experiencia; Fáciles De Seguir
Nichirei Corporation (2871.T) Bundle
Valoración de la Corporación Nichirei (2871T) con nuestra calculadora DCF personalizada! Con los datos financieros del Real Nichirei y las entradas de pronóstico flexibles, puede explorar escenarios y determinar el valor razonable de Nichirei en solo minutos.
What You Will Receive
- Flexible Forecast Inputs: Effortlessly modify assumptions (growth %, margins, WACC) to generate various scenarios.
- Real-World Data: Nichirei Corporation’s (2871T) financial data pre-loaded to facilitate your analysis.
- Automated DCF Outputs: The template computes Net Present Value (NPV) and intrinsic value for you.
- Tailor-Made and Professional: A refined Excel model that conforms to your valuation requirements.
- Designed for Analysts and Investors: Perfect for testing forecasts, affirming strategies, and enhancing efficiency.
Key Features
- Authentic Nichirei Data: Pre-loaded with Nichirei Corporation’s historical financials and future projections.
- Completely Customizable Inputs: Tailor revenue growth, profit margins, WACC, tax rates, and capital expenditures to your needs.
- Interactive Valuation Model: Instant updates to Net Present Value (NPV) and intrinsic value based on your provided inputs.
- Scenario Analysis: Generate various forecast scenarios to evaluate different valuation possibilities.
- User-Centric Design: Intuitive and organized, suitable for both experts and novices.
How It Functions
- Download the Template: Gain immediate access to the Excel-based Nichirei Corporation DCF Calculator.
- Input Your Assumptions: Modify the yellow-highlighted cells for growth rates, WACC, margins, and other variables.
- Instant Calculations: The model automatically recalculates Nichirei Corporation's intrinsic value.
- Test Scenarios: Experiment with different assumptions to assess potential changes in valuation.
- Analyze and Decide: Leverage the outcomes to inform your investment or financial decisions.
Why Choose This Calculator for Nichirei Corporation (2871T)?
- Accuracy: Leverages authentic Nichirei financial data for precise calculations.
- Flexibility: Enables users to easily adjust and experiment with various inputs.
- Time-Saving: Eliminate the need to create a DCF model from the ground up.
- Professional-Grade: Crafted with the expertise and attention to detail expected at the CFO level.
- User-Friendly: Intuitive interface suitable for users without advanced financial modeling skills.
Who Can Benefit from This Product?
- Investors: Assess Nichirei Corporation’s fair value accurately prior to making investment choices.
- CFOs: Utilize a professional-grade DCF model for comprehensive financial analysis and reporting.
- Consultants: Efficiently modify the template for client valuation reports.
- Entrepreneurs: Acquire valuable insights into financial modeling practices of leading firms.
- Educators: Employ it as a resource to illustrate valuation techniques in the classroom.
Contents of the Template
- Pre-Populated Data: Features Nichirei Corporation’s historical financial performance and projections.
- Discounted Cash Flow Model: An editable DCF valuation model that performs automatic calculations.
- Weighted Average Cost of Capital (WACC): A specific sheet for WACC calculations based on user-defined inputs.
- Essential Financial Ratios: Assess Nichirei Corporation’s profitability, efficiency, and capital structure.
- Adjustable Inputs: Easily modify revenue growth rates, profit margins, and tax rates.
- User-Friendly Dashboard: Visualizations and tables that summarize crucial valuation metrics.
Disclaimer
All information, articles, and product details provided on this website are for general informational and educational purposes only. We do not claim any ownership over, nor do we intend to infringe upon, any trademarks, copyrights, logos, brand names, or other intellectual property mentioned or depicted on this site. Such intellectual property remains the property of its respective owners, and any references here are made solely for identification or informational purposes, without implying any affiliation, endorsement, or partnership.
We make no representations or warranties, express or implied, regarding the accuracy, completeness, or suitability of any content or products presented. Nothing on this website should be construed as legal, tax, investment, financial, medical, or other professional advice. In addition, no part of this site—including articles or product references—constitutes a solicitation, recommendation, endorsement, advertisement, or offer to buy or sell any securities, franchises, or other financial instruments, particularly in jurisdictions where such activity would be unlawful.
All content is of a general nature and may not address the specific circumstances of any individual or entity. It is not a substitute for professional advice or services. Any actions you take based on the information provided here are strictly at your own risk. You accept full responsibility for any decisions or outcomes arising from your use of this website and agree to release us from any liability in connection with your use of, or reliance upon, the content or products found herein.