
|
Marine de Bestway & Energy Technology Co., Ltd (300008.SZ) DCF Valoración |
Completamente Editable: Adáptelo A Sus Necesidades En Excel O Sheets
Diseño Profesional: Plantillas Confiables Y Estándares De La Industria
Predeterminadas Para Un Uso Rápido Y Eficiente
Compatible con MAC / PC, completamente desbloqueado
No Se Necesita Experiencia; Fáciles De Seguir
Bestway Marine & Energy Technology Co.,Ltd (300008.SZ) Bundle
¡Optimice su tiempo y mejore la precisión con nuestra calculadora DCF (300008SZ)! Con datos reales de Bestway Marine & Energy Technology Co., Ltd y supuestos personalizables, esta herramienta le permite pronosticar, analizar y valorar Bestway como un inversor experimentado.
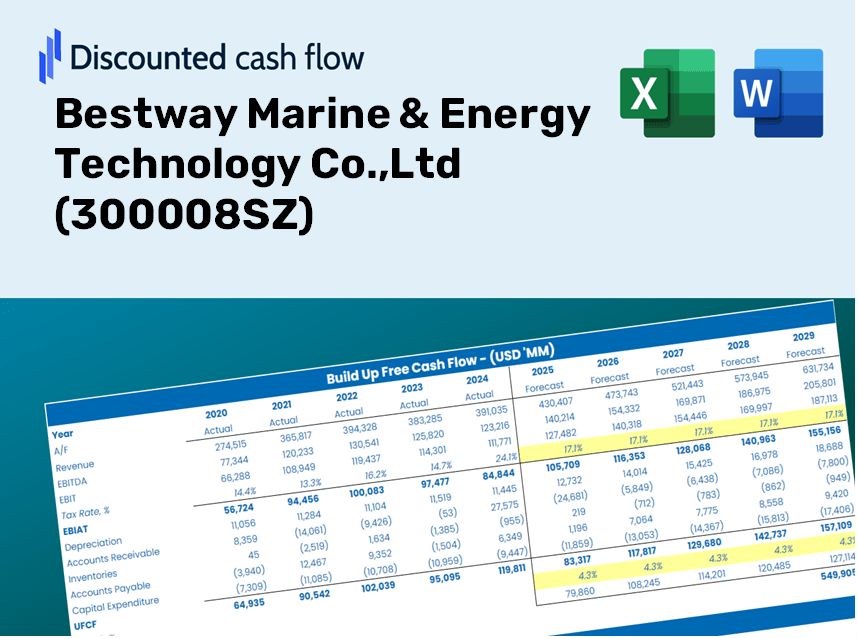
Discounted Cash Flow (DCF) - (USD MM)
| Year | AY1 2020 |
AY2 2021 |
AY3 2022 |
AY4 2023 |
AY5 2024 |
FY1 2025 |
FY2 2026 |
FY3 2027 |
FY4 2028 |
FY5 2029 |
|---|---|---|---|---|---|---|---|---|---|---|
| Revenue | 523.6 | 1,421.7 | 2,729.5 | 3,606.5 | 3,945.3 | 6,248.5 | 9,896.1 | 15,673.2 | 24,822.7 | 39,313.4 |
| Revenue Growth, % | 0 | 171.56 | 91.98 | 32.13 | 9.4 | 58.38 | 58.38 | 58.38 | 58.38 | 58.38 |
| EBITDA | 78.6 | 65.1 | 84.4 | 177.6 | 235.1 | 419.4 | 664.2 | 1,052.0 | 1,666.1 | 2,638.7 |
| EBITDA, % | 15.01 | 4.58 | 3.09 | 4.92 | 5.96 | 6.71 | 6.71 | 6.71 | 6.71 | 6.71 |
| Depreciation | 34.1 | 31.1 | 33.2 | 47.2 | 54.8 | 157.5 | 249.4 | 395.0 | 625.6 | 990.9 |
| Depreciation, % | 6.5 | 2.19 | 1.21 | 1.31 | 1.39 | 2.52 | 2.52 | 2.52 | 2.52 | 2.52 |
| EBIT | 44.5 | 34.0 | 51.3 | 130.4 | 180.3 | 261.9 | 414.8 | 656.9 | 1,040.4 | 1,647.8 |
| EBIT, % | 8.5 | 2.39 | 1.88 | 3.62 | 4.57 | 4.19 | 4.19 | 4.19 | 4.19 | 4.19 |
| Total Cash | 411.0 | 399.7 | 604.6 | 891.7 | 632.8 | 2,118.6 | 3,355.4 | 5,314.2 | 8,416.5 | 13,329.8 |
| Total Cash, percent | .0 | .0 | .0 | .0 | .0 | .0 | .0 | .0 | .0 | .0 |
| Account Receivables | 309.3 | 498.6 | 1,134.1 | 1,134.2 | 1,595.9 | 2,594.4 | 4,108.9 | 6,507.5 | 10,306.4 | 16,323.0 |
| Account Receivables, % | 59.08 | 35.07 | 41.55 | 31.45 | 40.45 | 41.52 | 41.52 | 41.52 | 41.52 | 41.52 |
| Inventories | 99.7 | 195.9 | 316.1 | 367.8 | 297.3 | 776.5 | 1,229.7 | 1,947.6 | 3,084.6 | 4,885.3 |
| Inventories, % | 19.04 | 13.78 | 11.58 | 10.2 | 7.54 | 12.43 | 12.43 | 12.43 | 12.43 | 12.43 |
| Accounts Payable | 128.6 | 274.5 | 702.6 | 787.1 | 816.0 | 1,401.2 | 2,219.1 | 3,514.5 | 5,566.2 | 8,815.6 |
| Accounts Payable, % | 24.57 | 19.31 | 25.74 | 21.82 | 20.68 | 22.42 | 22.42 | 22.42 | 22.42 | 22.42 |
| Capital Expenditure | -5.6 | -57.0 | -54.1 | -77.0 | -70.0 | -137.0 | -217.0 | -343.7 | -544.3 | -862.1 |
| Capital Expenditure, % | -1.07 | -4.01 | -1.98 | -2.14 | -1.78 | -2.19 | -2.19 | -2.19 | -2.19 | -2.19 |
| Tax Rate, % | 17.57 | 17.57 | 17.57 | 17.57 | 17.57 | 17.57 | 17.57 | 17.57 | 17.57 | 17.57 |
| EBITAT | 64.7 | 43.2 | 47.4 | 94.1 | 148.6 | 234.1 | 370.8 | 587.3 | 930.1 | 1,473.1 |
| Depreciation | ||||||||||
| Changes in Account Receivables | ||||||||||
| Changes in Inventories | ||||||||||
| Changes in Accounts Payable | ||||||||||
| Capital Expenditure | ||||||||||
| UFCF | -187.2 | -122.2 | -301.2 | 97.0 | -228.8 | -638.0 | -746.6 | -1,182.5 | -1,872.8 | -2,966.0 |
| WACC, % | 4.81 | 4.81 | 4.79 | 4.73 | 4.76 | 4.78 | 4.78 | 4.78 | 4.78 | 4.78 |
| PV UFCF | ||||||||||
| SUM PV UFCF | -6,218.3 | |||||||||
| Long Term Growth Rate, % | 3.00 | |||||||||
| Free cash flow (T + 1) | -3,055 | |||||||||
| Terminal Value | -171,329 | |||||||||
| Present Terminal Value | -135,636 | |||||||||
| Enterprise Value | -141,854 | |||||||||
| Net Debt | 108 | |||||||||
| Equity Value | -141,962 | |||||||||
| Diluted Shares Outstanding, MM | 1,727 | |||||||||
| Equity Value Per Share | -82.18 |
What You Will Gain
- Detailed Bestway Financials: Access to both historical and projected data for precise valuation.
- Customizable Inputs: Adjust metrics like WACC, tax rates, revenue growth, and capital expenditures as needed.
- Real-Time Calculations: Intrinsic value and NPV are computed automatically.
- Scenario Analysis: Explore various scenarios to assess Bestway's future performance.
- User-Friendly Design: Designed for industry professionals but easy to navigate for newcomers.
Key Features
- Customizable Forecast Variables: Adjust essential metrics such as revenue growth, EBITDA percentage, and capital expenses.
- Instant DCF Valuation: Quickly computes intrinsic value, NPV, and other essential metrics.
- High-Precision Accuracy: Leverages Bestway Marine & Energy’s actual financial data for dependable valuation results.
- Simplified Scenario Analysis: Effortlessly evaluate various scenarios and compare results.
- Efficiency Booster: Streamline your process by avoiding the creation of intricate valuation models from the ground up.
How It Works
- Step 1: Download the Excel file for Bestway Marine & Energy Technology Co., Ltd (300008SZ).
- Step 2: Review the pre-filled financial data and forecasts for Bestway Marine & Energy Technology Co., Ltd (300008SZ).
- Step 3: Adjust key inputs such as revenue growth, WACC, and tax rates (highlighted cells).
- Step 4: Observe the DCF model update in real-time as you change your assumptions.
- Step 5: Evaluate the outputs and utilize the results for your investment strategies.
Why Choose Bestway Marine & Energy Technology Co., Ltd (300008SZ)?
- Precision: Utilizes accurate data tailored specifically for Bestway's financials.
- Adaptability: Users can easily test and adjust inputs to meet their needs.
- Efficiency: Eliminate the complexities of creating a financial model from the ground up.
- Top-Tier Quality: Engineered with the expertise expected at the executive level.
- Intuitive Interface: Designed for ease of use, making it accessible for users without extensive financial experience.
Who Can Benefit from Bestway Marine & Energy Technology Co., Ltd (300008SZ)?
- Investors: Make informed investment choices with our comprehensive valuation tool tailored for marine and energy sectors.
- Financial Analysts: Optimize your workflow with a customizable DCF model specifically designed for our unique industry.
- Consultants: Effortlessly modify the template for client briefs or presentations related to marine and energy technologies.
- Finance Enthusiasts: Enhance your expertise in valuation methods with case studies from the marine and energy landscape.
- Educators and Students: Utilize it as a hands-on resource in finance and energy technology courses.
Contents of the Template
- Preloaded Bestway Marine & Energy Data: Historical and projected financial figures, including revenue, EBIT, and capital expenditures.
- DCF and WACC Models: Professional-quality sheets designed for calculating intrinsic value and Weighted Average Cost of Capital.
- Customizable Inputs: Yellow-highlighted cells for modifying revenue growth, tax rates, and discount rates.
- Financial Statements: Detailed annual and quarterly financials for extensive analysis.
- Key Ratios: Ratios related to profitability, leverage, and efficiency for performance assessment.
- Dashboard and Charts: Visual representations of valuation results and underlying assumptions.
Disclaimer
All information, articles, and product details provided on this website are for general informational and educational purposes only. We do not claim any ownership over, nor do we intend to infringe upon, any trademarks, copyrights, logos, brand names, or other intellectual property mentioned or depicted on this site. Such intellectual property remains the property of its respective owners, and any references here are made solely for identification or informational purposes, without implying any affiliation, endorsement, or partnership.
We make no representations or warranties, express or implied, regarding the accuracy, completeness, or suitability of any content or products presented. Nothing on this website should be construed as legal, tax, investment, financial, medical, or other professional advice. In addition, no part of this site—including articles or product references—constitutes a solicitation, recommendation, endorsement, advertisement, or offer to buy or sell any securities, franchises, or other financial instruments, particularly in jurisdictions where such activity would be unlawful.
All content is of a general nature and may not address the specific circumstances of any individual or entity. It is not a substitute for professional advice or services. Any actions you take based on the information provided here are strictly at your own risk. You accept full responsibility for any decisions or outcomes arising from your use of this website and agree to release us from any liability in connection with your use of, or reliance upon, the content or products found herein.