
|
Aier Eye Hospital Group Co., Ltd. (300015.SZ) Valoración de DCF |
Completamente Editable: Adáptelo A Sus Necesidades En Excel O Sheets
Diseño Profesional: Plantillas Confiables Y Estándares De La Industria
Predeterminadas Para Un Uso Rápido Y Eficiente
Compatible con MAC / PC, completamente desbloqueado
No Se Necesita Experiencia; Fáciles De Seguir
Aier Eye Hospital Group Co., Ltd. (300015.SZ) Bundle
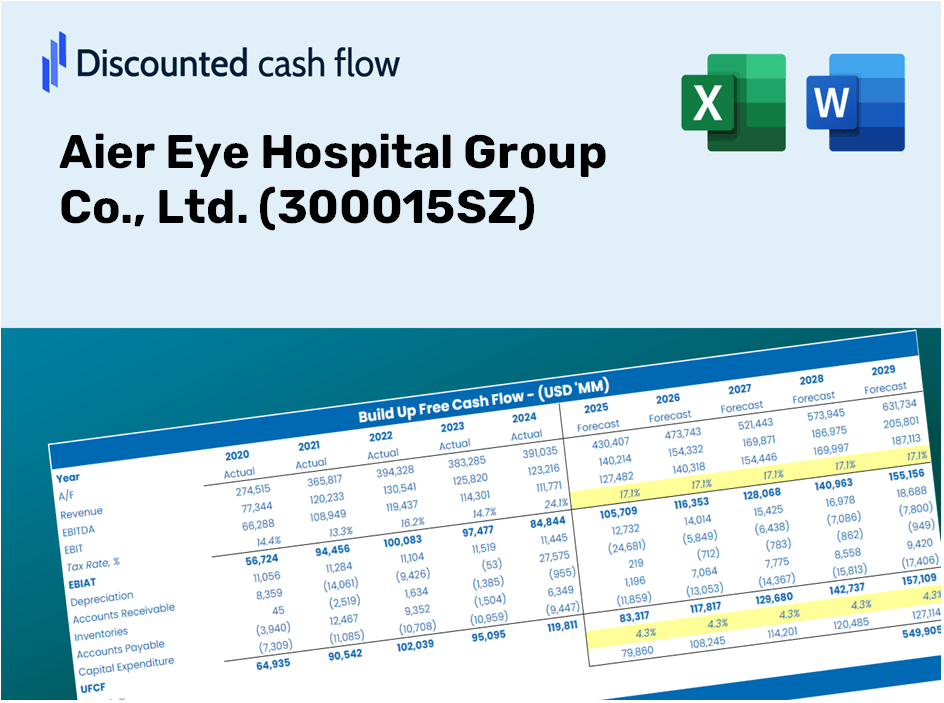
¡Agilice su proceso y mejore la precisión con nuestra calculadora DCF (300015SZ)! Utilizando datos reales de Aier Eye Hospital Group Co., Ltd. y supuestos personalizables, esta herramienta le permite pronosticar, analizar y evaluar (300015SZ) como un inversor experimentado.
Discounted Cash Flow (DCF) - (USD MM)
| Year | AY1 2020 |
AY2 2021 |
AY3 2022 |
AY4 2023 |
AY5 2024 |
FY1 2025 |
FY2 2026 |
FY3 2027 |
FY4 2028 |
FY5 2029 |
|---|---|---|---|---|---|---|---|---|---|---|
| Revenue | 11,912.4 | 15,000.8 | 16,109.9 | 20,367.2 | 20,982.9 | 24,275.6 | 28,085.0 | 32,492.1 | 37,590.8 | 43,489.7 |
| Revenue Growth, % | 0 | 25.93 | 7.39 | 26.43 | 3.02 | 15.69 | 15.69 | 15.69 | 15.69 | 15.69 |
| EBITDA | 3,718.2 | 4,511.2 | 4,506.5 | 5,910.8 | 5,276.0 | 6,963.5 | 8,056.2 | 9,320.4 | 10,783.0 | 12,475.0 |
| EBITDA, % | 31.21 | 30.07 | 27.97 | 29.02 | 25.14 | 28.69 | 28.69 | 28.69 | 28.69 | 28.69 |
| Depreciation | 415.9 | 489.2 | 619.8 | 687.7 | 820.8 | 868.5 | 1,004.8 | 1,162.5 | 1,344.9 | 1,555.9 |
| Depreciation, % | 3.49 | 3.26 | 3.85 | 3.38 | 3.91 | 3.58 | 3.58 | 3.58 | 3.58 | 3.58 |
| EBIT | 3,302.3 | 4,022.0 | 3,886.7 | 5,223.1 | 4,455.2 | 6,095.0 | 7,051.4 | 8,157.9 | 9,438.1 | 10,919.1 |
| EBIT, % | 27.72 | 26.81 | 24.13 | 25.64 | 21.23 | 25.11 | 25.11 | 25.11 | 25.11 | 25.11 |
| Total Cash | 3,363.1 | 4,702.3 | 6,904.2 | 6,910.3 | 6,090.1 | 8,029.8 | 9,289.9 | 10,747.7 | 12,434.2 | 14,385.4 |
| Total Cash, percent | .0 | .0 | .0 | .0 | .0 | .0 | .0 | .0 | .0 | .0 |
| Account Receivables | 1,602.1 | 1,784.2 | 1,808.8 | 2,144.3 | 2,294.4 | 2,817.6 | 3,259.8 | 3,771.3 | 4,363.1 | 5,047.7 |
| Account Receivables, % | 13.45 | 11.89 | 11.23 | 10.53 | 10.93 | 11.61 | 11.61 | 11.61 | 11.61 | 11.61 |
| Inventories | 494.6 | 571.3 | 731.0 | 899.7 | 985.5 | 1,049.3 | 1,213.9 | 1,404.4 | 1,624.8 | 1,879.8 |
| Inventories, % | 4.15 | 3.81 | 4.54 | 4.42 | 4.7 | 4.32 | 4.32 | 4.32 | 4.32 | 4.32 |
| Accounts Payable | 1,454.0 | 1,379.9 | 1,465.7 | 1,871.7 | 2,040.4 | 2,399.2 | 2,775.7 | 3,211.3 | 3,715.2 | 4,298.3 |
| Accounts Payable, % | 12.21 | 9.2 | 9.1 | 9.19 | 9.72 | 9.88 | 9.88 | 9.88 | 9.88 | 9.88 |
| Capital Expenditure | -893.7 | -1,494.1 | -1,388.2 | -1,459.7 | -1,830.1 | -2,037.6 | -2,357.4 | -2,727.3 | -3,155.3 | -3,650.4 |
| Capital Expenditure, % | -7.5 | -9.96 | -8.62 | -7.17 | -8.72 | -8.39 | -8.39 | -8.39 | -8.39 | -8.39 |
| Tax Rate, % | 22.6 | 22.6 | 22.6 | 22.6 | 22.6 | 22.6 | 22.6 | 22.6 | 22.6 | 22.6 |
| EBITAT | 2,408.7 | 2,968.6 | 2,941.8 | 3,854.9 | 3,448.4 | 4,554.7 | 5,269.4 | 6,096.3 | 7,053.0 | 8,159.8 |
| Depreciation | ||||||||||
| Changes in Account Receivables | ||||||||||
| Changes in Inventories | ||||||||||
| Changes in Accounts Payable | ||||||||||
| Capital Expenditure | ||||||||||
| UFCF | 1,288.2 | 1,630.9 | 2,074.9 | 2,984.7 | 2,371.9 | 3,157.4 | 3,686.6 | 4,265.1 | 4,934.4 | 5,708.7 |
| WACC, % | 6.82 | 6.82 | 6.83 | 6.82 | 6.83 | 6.83 | 6.83 | 6.83 | 6.83 | 6.83 |
| PV UFCF | ||||||||||
| SUM PV UFCF | 17,577.2 | |||||||||
| Long Term Growth Rate, % | 3.50 | |||||||||
| Free cash flow (T + 1) | 5,908 | |||||||||
| Terminal Value | 177,641 | |||||||||
| Present Terminal Value | 127,690 | |||||||||
| Enterprise Value | 145,267 | |||||||||
| Net Debt | 651 | |||||||||
| Equity Value | 144,615 | |||||||||
| Diluted Shares Outstanding, MM | 9,244 | |||||||||
| Equity Value Per Share | 15.64 |
What You Will Receive
- Authentic AIER Financials: Access to historical and projected data for precise evaluation.
- Customizable Inputs: Adjust WACC, tax rates, revenue growth, and capital expenditures as needed.
- Real-time Calculations: Dynamic computation of intrinsic value and NPV.
- Scenario Analysis: Explore various scenarios to assess Aier Eye Hospital's future performance.
- User-Friendly Design: Tailored for professionals while remaining accessible to newcomers.
Key Features
- Comprehensive Data Access: Aier Eye Hospital Group’s historical financial reports and projected forecasts are readily available.
- Customizable Parameters: Easily modify WACC, tax rates, revenue growth, and EBITDA margins to fit your analysis.
- Real-Time Insights: Instantly view Aier Eye Hospital Group's intrinsic value update as adjustments are made.
- Intuitive Visualization: Dynamic dashboard charts present valuation outcomes and essential metrics clearly.
- Designed for Precision: A reliable resource tailored for analysts, investors, and finance professionals.
How It Functions
- Download the Template: Gain instant access to the Excel-based Aier Eye Hospital DCF Calculator for (300015SZ).
- Input Your Assumptions: Modify the yellow-highlighted cells to set growth rates, WACC, margins, and other variables.
- Instant Calculations: The model automatically recalculates the intrinsic value of Aier Eye Hospital.
- Test Scenarios: Experiment with varying assumptions to assess potential changes in valuation.
- Analyze and Decide: Utilize the outcomes to inform your investment strategies or financial evaluations.
Why Choose Aier Eye Hospital Group Calculator?
- User-Friendly Interface: Suitable for both novices and seasoned professionals.
- Customizable Inputs: Effortlessly adjust assumptions to tailor your analysis.
- Real-Time Updates: Observe immediate changes to Aier Eye Hospital's valuation as you tweak parameters.
- Pre-Configured Data: Comes with Aier Eye Hospital’s latest financial information for swift analysis.
- Preferred by Industry Experts: A tool for investors and analysts to make well-informed choices.
Who Should Utilize This Service?
- Investors: Evaluate Aier Eye Hospital Group's valuation before making stock transactions.
- Chief Financial Officers and Financial Analysts: Optimize valuation methodologies and validate financial forecasts.
- Healthcare Entrepreneurs: Understand how leading companies like Aier Eye Hospital are assessed in terms of value.
- Consultants: Provide expert valuation reports to clients in the healthcare sector.
- Students and Educators: Utilize real-world data to practice and teach valuation strategies.
Contents of the Template
- Pre-Filled Data: Contains Aier Eye Hospital Group's historical financial information and projections.
- Discounted Cash Flow Model: An editable DCF valuation model with automatic calculation features.
- Weighted Average Cost of Capital (WACC): A dedicated worksheet for WACC calculation using personalized inputs.
- Key Financial Ratios: Evaluate Aier Eye Hospital Group's profitability, efficiency, and financial leverage.
- Customizable Inputs: Easily modify revenue growth rates, profit margins, and tax percentages.
- Clear Dashboard: Visual summaries through charts and tables displaying essential valuation outcomes.
Disclaimer
All information, articles, and product details provided on this website are for general informational and educational purposes only. We do not claim any ownership over, nor do we intend to infringe upon, any trademarks, copyrights, logos, brand names, or other intellectual property mentioned or depicted on this site. Such intellectual property remains the property of its respective owners, and any references here are made solely for identification or informational purposes, without implying any affiliation, endorsement, or partnership.
We make no representations or warranties, express or implied, regarding the accuracy, completeness, or suitability of any content or products presented. Nothing on this website should be construed as legal, tax, investment, financial, medical, or other professional advice. In addition, no part of this site—including articles or product references—constitutes a solicitation, recommendation, endorsement, advertisement, or offer to buy or sell any securities, franchises, or other financial instruments, particularly in jurisdictions where such activity would be unlawful.
All content is of a general nature and may not address the specific circumstances of any individual or entity. It is not a substitute for professional advice or services. Any actions you take based on the information provided here are strictly at your own risk. You accept full responsibility for any decisions or outcomes arising from your use of this website and agree to release us from any liability in connection with your use of, or reliance upon, the content or products found herein.