
|
Hunan Zhongke Electric Co., Ltd. (300035.sz) Valoración de DCF |
Completamente Editable: Adáptelo A Sus Necesidades En Excel O Sheets
Diseño Profesional: Plantillas Confiables Y Estándares De La Industria
Predeterminadas Para Un Uso Rápido Y Eficiente
Compatible con MAC / PC, completamente desbloqueado
No Se Necesita Experiencia; Fáciles De Seguir
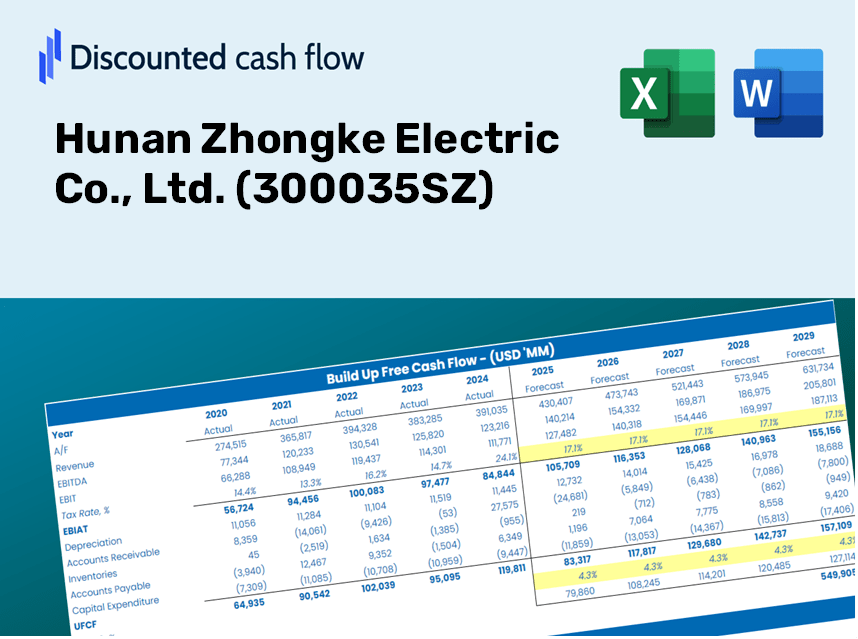
Hunan Zhongke Electric Co., Ltd. (300035.SZ) Bundle
¡Explore las perspectivas financieras de Hunan Zhongke Electric Co., Ltd. (300035SZ) con nuestra calculadora DCF fácil de usar! Ingrese sus suposiciones para el crecimiento, los márgenes y los costos para determinar el valor intrínseco de Hunan Zhongke Electric Co., Ltd. (300035SZ) y refinar su estrategia de inversión.
Discounted Cash Flow (DCF) - (USD MM)
| Year | AY1 2020 |
AY2 2021 |
AY3 2022 |
AY4 2023 |
AY5 2024 |
FY1 2025 |
FY2 2026 |
FY3 2027 |
FY4 2028 |
FY5 2029 |
|---|---|---|---|---|---|---|---|---|---|---|
| Revenue | 973.6 | 2,193.9 | 5,256.8 | 4,907.5 | 5,581.0 | 8,470.4 | 12,855.5 | 19,510.8 | 29,611.6 | 44,941.7 |
| Revenue Growth, % | 0 | 125.33 | 139.61 | -6.64 | 13.72 | 51.77 | 51.77 | 51.77 | 51.77 | 51.77 |
| EBITDA | 220.1 | 472.2 | 609.5 | 353.1 | 914.5 | 1,343.5 | 2,039.0 | 3,094.6 | 4,696.6 | 7,128.1 |
| EBITDA, % | 22.6 | 21.52 | 11.6 | 7.2 | 16.39 | 15.86 | 15.86 | 15.86 | 15.86 | 15.86 |
| Depreciation | 41.6 | 53.3 | 106.8 | 229.5 | 316.8 | 323.4 | 490.8 | 744.9 | 1,130.5 | 1,715.8 |
| Depreciation, % | 4.28 | 2.43 | 2.03 | 4.68 | 5.68 | 3.82 | 3.82 | 3.82 | 3.82 | 3.82 |
| EBIT | 178.4 | 418.9 | 502.7 | 123.6 | 597.7 | 1,020.1 | 1,548.2 | 2,349.7 | 3,566.1 | 5,412.3 |
| EBIT, % | 18.33 | 19.1 | 9.56 | 2.52 | 10.71 | 12.04 | 12.04 | 12.04 | 12.04 | 12.04 |
| Total Cash | 283.9 | 1,462.7 | 1,559.8 | 878.4 | 426.9 | 2,558.9 | 3,883.6 | 5,894.2 | 8,945.6 | 13,576.8 |
| Total Cash, percent | .0 | .0 | .0 | .0 | .0 | .0 | .0 | .0 | .0 | .0 |
| Account Receivables | 759.1 | 1,493.5 | 2,354.8 | 2,416.1 | 3,090.7 | 5,005.2 | 7,596.4 | 11,529.1 | 17,497.7 | 26,556.3 |
| Account Receivables, % | 77.97 | 68.08 | 44.8 | 49.23 | 55.38 | 59.09 | 59.09 | 59.09 | 59.09 | 59.09 |
| Inventories | 386.4 | 854.9 | 2,952.9 | 1,823.4 | 2,151.6 | 3,566.6 | 5,413.0 | 8,215.3 | 12,468.4 | 18,923.3 |
| Inventories, % | 39.68 | 38.97 | 56.17 | 37.16 | 38.55 | 42.11 | 42.11 | 42.11 | 42.11 | 42.11 |
| Accounts Payable | 266.4 | 640.3 | 1,542.9 | 1,329.0 | 1,806.0 | 2,462.1 | 3,736.7 | 5,671.2 | 8,607.3 | 13,063.3 |
| Accounts Payable, % | 27.36 | 29.19 | 29.35 | 27.08 | 32.36 | 29.07 | 29.07 | 29.07 | 29.07 | 29.07 |
| Capital Expenditure | -110.8 | -522.4 | -1,308.8 | -339.5 | -205.2 | -1,197.5 | -1,817.4 | -2,758.3 | -4,186.2 | -6,353.5 |
| Capital Expenditure, % | -11.38 | -23.81 | -24.9 | -6.92 | -3.68 | -14.14 | -14.14 | -14.14 | -14.14 | -14.14 |
| Tax Rate, % | 34.99 | 34.99 | 34.99 | 34.99 | 34.99 | 34.99 | 34.99 | 34.99 | 34.99 | 34.99 |
| EBITAT | 159.0 | 374.5 | 508.3 | -199.7 | 388.5 | 700.8 | 1,063.7 | 1,614.3 | 2,450.1 | 3,718.5 |
| Depreciation | ||||||||||
| Changes in Account Receivables | ||||||||||
| Changes in Inventories | ||||||||||
| Changes in Accounts Payable | ||||||||||
| Capital Expenditure | ||||||||||
| UFCF | -789.3 | -923.6 | -2,750.4 | 544.6 | -25.7 | -2,846.6 | -3,425.9 | -5,199.5 | -7,891.3 | -11,976.7 |
| WACC, % | 10.54 | 10.54 | 10.62 | 9.9 | 10.37 | 10.39 | 10.39 | 10.39 | 10.39 | 10.39 |
| PV UFCF | ||||||||||
| SUM PV UFCF | -21,873.7 | |||||||||
| Long Term Growth Rate, % | 4.00 | |||||||||
| Free cash flow (T + 1) | -12,456 | |||||||||
| Terminal Value | -194,845 | |||||||||
| Present Terminal Value | -118,847 | |||||||||
| Enterprise Value | -140,721 | |||||||||
| Net Debt | 1,841 | |||||||||
| Equity Value | -142,562 | |||||||||
| Diluted Shares Outstanding, MM | 690 | |||||||||
| Equity Value Per Share | -206.63 |
What You Will Experience
- Authentic Hunan Zhongke Electric Data: Pre-loaded with historical and forecasted data for in-depth analysis.
- Completely Customizable Template: Easily adjust key inputs such as revenue growth, WACC, and EBITDA percentage.
- Instant Calculations: Witness real-time updates to Hunan Zhongke Electric's intrinsic value as you make changes.
- Expert Valuation Tool: Tailored for investors, analysts, and consultants aiming for precise DCF outcomes.
- Intuitive Design: Streamlined layout and straightforward instructions suitable for all skill levels.
Key Features
- Comprehensive DCF Calculator: Features detailed unlevered and levered DCF valuation models tailored for Hunan Zhongke Electric Co., Ltd. (300035SZ).
- WACC Calculator: Pre-designed Weighted Average Cost of Capital sheet with adjustable inputs specific to the industry.
- Customizable Forecast Assumptions: Easily adjust growth rates, capital expenditures, and discount rates to fit market expectations.
- Integrated Financial Ratios: Assess profitability, leverage, and efficiency ratios relevant to Hunan Zhongke Electric Co., Ltd. (300035SZ).
- Insights Dashboard and Charts: Visual representations highlight essential valuation metrics for streamlined analysis.
How It Functions
- Step 1: Download the Excel spreadsheet.
- Step 2: Examine the pre-filled Hunan Zhongke Electric data (both historical and projected).
- Step 3: Modify key assumptions (yellow cells) according to your analysis.
- Step 4: Observe automatic recalculations for Hunan Zhongke Electric's intrinsic value.
- Step 5: Utilize the results for investment decisions or reporting.
Why Choose Hunan Zhongke Electric Co., Ltd. (300035SZ)?
- Precision: Leveraging accurate financial data for reliable insights.
- Adaptability: Crafted for users to easily adjust and explore different scenarios.
- Efficiency: Eliminate the need to create complex financial models from the ground up.
- Expert-Level Quality: Designed with the expertise and usability that professionals expect.
- Intuitive Interface: Simple to navigate, making it accessible for users of all skill levels.
Who Can Benefit from Hunan Zhongke Electric Co., Ltd. (300035SZ)?
- Investors: Make informed investment choices with our advanced valuation tools.
- Financial Analysts: Streamline your workflow with our ready-to-customize DCF model.
- Consultants: Effortlessly modify the template for client presentations or detailed reports.
- Finance Enthusiasts: Expand your knowledge of valuation methods through practical, real-world applications.
- Educators and Students: Utilize our resources as a hands-on learning aid in finance-related studies.
Contents of the Template
- Comprehensive DCF Model: Fully editable template featuring detailed valuation calculations.
- Real-World Data: Hunan Zhongke Electric Co., Ltd.'s (300035SZ) historical and projected financials preloaded for in-depth analysis.
- Customizable Parameters: Modify WACC, growth rates, and tax assumptions to explore various scenarios.
- Financial Statements: Complete annual and quarterly breakdowns for enhanced insights.
- Key Ratios: Integrated analysis of profitability, efficiency, and leverage.
- Dashboard with Visual Outputs: Includes charts and tables for clear and actionable results.
Disclaimer
All information, articles, and product details provided on this website are for general informational and educational purposes only. We do not claim any ownership over, nor do we intend to infringe upon, any trademarks, copyrights, logos, brand names, or other intellectual property mentioned or depicted on this site. Such intellectual property remains the property of its respective owners, and any references here are made solely for identification or informational purposes, without implying any affiliation, endorsement, or partnership.
We make no representations or warranties, express or implied, regarding the accuracy, completeness, or suitability of any content or products presented. Nothing on this website should be construed as legal, tax, investment, financial, medical, or other professional advice. In addition, no part of this site—including articles or product references—constitutes a solicitation, recommendation, endorsement, advertisement, or offer to buy or sell any securities, franchises, or other financial instruments, particularly in jurisdictions where such activity would be unlawful.
All content is of a general nature and may not address the specific circumstances of any individual or entity. It is not a substitute for professional advice or services. Any actions you take based on the information provided here are strictly at your own risk. You accept full responsibility for any decisions or outcomes arising from your use of this website and agree to release us from any liability in connection with your use of, or reliance upon, the content or products found herein.