
|
Shenzhen Capchem Technology Co., Ltd. (300037.SZ) Valoración de DCF |
Completamente Editable: Adáptelo A Sus Necesidades En Excel O Sheets
Diseño Profesional: Plantillas Confiables Y Estándares De La Industria
Predeterminadas Para Un Uso Rápido Y Eficiente
Compatible con MAC / PC, completamente desbloqueado
No Se Necesita Experiencia; Fáciles De Seguir
Shenzhen Capchem Technology Co., Ltd. (300037.SZ) Bundle
¡Obtenga información sobre su análisis de valoración de Shenzhen Capchem Technology Co., Ltd. (300037SZ) con nuestra sofisticada calculadora DCF! Con datos reales (300037SZ), esta plantilla de Excel le permite modificar pronósticos y supuestos para un cálculo preciso del valor intrínseco de Shenzhen Capchem.
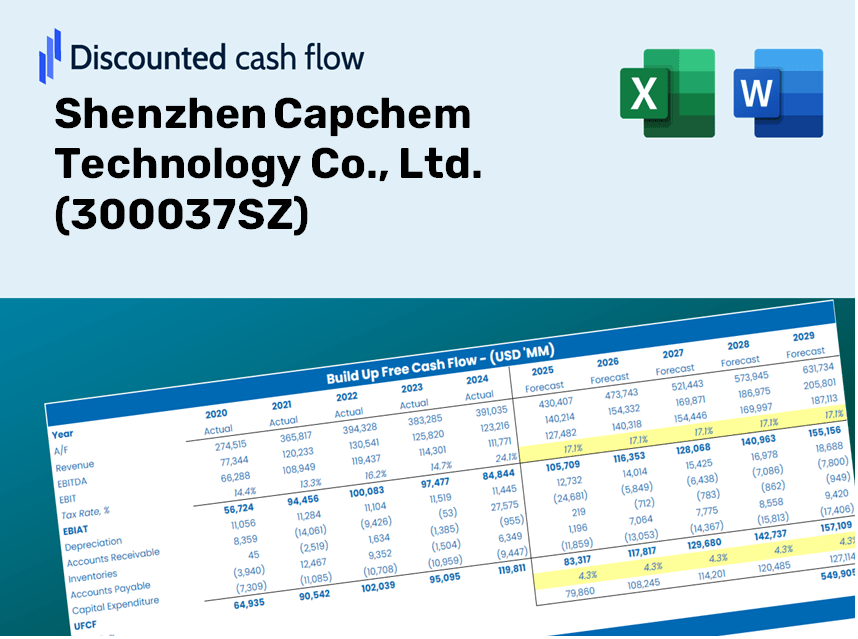
Discounted Cash Flow (DCF) - (USD MM)
| Year | AY1 2020 |
AY2 2021 |
AY3 2022 |
AY4 2023 |
AY5 2024 |
FY1 2025 |
FY2 2026 |
FY3 2027 |
FY4 2028 |
FY5 2029 |
|---|---|---|---|---|---|---|---|---|---|---|
| Revenue | 2,961.0 | 6,951.3 | 9,660.7 | 7,484.0 | 7,846.8 | 10,226.2 | 13,327.1 | 17,368.4 | 22,635.1 | 29,498.8 |
| Revenue Growth, % | 0 | 134.76 | 38.98 | -22.53 | 4.85 | 30.32 | 30.32 | 30.32 | 30.32 | 30.32 |
| EBITDA | 734.1 | 1,650.9 | 2,206.8 | 1,436.0 | 1,573.3 | 2,262.5 | 2,948.6 | 3,842.7 | 5,007.9 | 6,526.5 |
| EBITDA, % | 24.79 | 23.75 | 22.84 | 19.19 | 20.05 | 22.12 | 22.12 | 22.12 | 22.12 | 22.12 |
| Depreciation | 145.4 | 184.2 | 235.9 | 297.8 | 440.3 | 400.7 | 522.2 | 680.6 | 887.0 | 1,156.0 |
| Depreciation, % | 4.91 | 2.65 | 2.44 | 3.98 | 5.61 | 3.92 | 3.92 | 3.92 | 3.92 | 3.92 |
| EBIT | 588.7 | 1,466.7 | 1,970.9 | 1,138.2 | 1,132.9 | 1,861.8 | 2,426.3 | 3,162.1 | 4,120.9 | 5,370.5 |
| EBIT, % | 19.88 | 21.1 | 20.4 | 15.21 | 14.44 | 18.21 | 18.21 | 18.21 | 18.21 | 18.21 |
| Total Cash | 2,131.1 | 1,876.8 | 4,114.4 | 4,837.6 | 3,427.3 | 5,110.6 | 6,660.3 | 8,679.9 | 11,311.9 | 14,742.1 |
| Total Cash, percent | .0 | .0 | .0 | .0 | .0 | .0 | .0 | .0 | .0 | .0 |
| Account Receivables | 1,612.7 | 4,057.1 | 4,533.3 | 3,469.2 | 3,550.1 | 5,140.7 | 6,699.6 | 8,731.1 | 11,378.7 | 14,829.1 |
| Account Receivables, % | 54.46 | 58.36 | 46.93 | 46.35 | 45.24 | 50.27 | 50.27 | 50.27 | 50.27 | 50.27 |
| Inventories | 443.6 | 810.0 | 905.1 | 907.5 | 997.0 | 1,244.2 | 1,621.5 | 2,113.2 | 2,754.1 | 3,589.2 |
| Inventories, % | 14.98 | 11.65 | 9.37 | 12.13 | 12.71 | 12.17 | 12.17 | 12.17 | 12.17 | 12.17 |
| Accounts Payable | 1,079.2 | 2,276.0 | 2,726.4 | 3,549.3 | 2,921.5 | 3,723.7 | 4,852.9 | 6,324.5 | 8,242.2 | 10,741.6 |
| Accounts Payable, % | 36.45 | 32.74 | 28.22 | 47.43 | 37.23 | 36.41 | 36.41 | 36.41 | 36.41 | 36.41 |
| Capital Expenditure | -364.1 | -598.4 | -1,759.5 | -1,790.0 | -1,181.4 | -1,597.1 | -2,081.4 | -2,712.6 | -3,535.1 | -4,607.1 |
| Capital Expenditure, % | -12.29 | -8.61 | -18.21 | -23.92 | -15.06 | -15.62 | -15.62 | -15.62 | -15.62 | -15.62 |
| Tax Rate, % | 13.96 | 13.96 | 13.96 | 13.96 | 13.96 | 13.96 | 13.96 | 13.96 | 13.96 | 13.96 |
| EBITAT | 505.2 | 1,252.4 | 1,682.9 | 988.2 | 974.8 | 1,599.1 | 2,084.0 | 2,716.0 | 3,539.5 | 4,612.9 |
| Depreciation | ||||||||||
| Changes in Account Receivables | ||||||||||
| Changes in Inventories | ||||||||||
| Changes in Accounts Payable | ||||||||||
| Capital Expenditure | ||||||||||
| UFCF | -690.5 | -775.7 | 38.4 | 1,380.7 | -564.5 | -632.9 | -282.1 | -367.7 | -479.1 | -624.4 |
| WACC, % | 6.39 | 6.39 | 6.39 | 6.39 | 6.39 | 6.39 | 6.39 | 6.39 | 6.39 | 6.39 |
| PV UFCF | ||||||||||
| SUM PV UFCF | -1,981.6 | |||||||||
| Long Term Growth Rate, % | 3.00 | |||||||||
| Free cash flow (T + 1) | -643 | |||||||||
| Terminal Value | -18,980 | |||||||||
| Present Terminal Value | -13,926 | |||||||||
| Enterprise Value | -15,908 | |||||||||
| Net Debt | 412 | |||||||||
| Equity Value | -16,319 | |||||||||
| Diluted Shares Outstanding, MM | 754 | |||||||||
| Equity Value Per Share | -21.65 |
What You'll Receive
- Flexible Forecast Inputs: Effortlessly adjust assumptions (growth %, margins, WACC) to explore various scenarios.
- Industry-Specific Data: Pre-filled financial information for Shenzhen Capchem Technology Co., Ltd. (300037SZ) to kickstart your analysis.
- Instant DCF Outputs: The model automatically computes Net Present Value (NPV) and intrinsic value for your convenience.
- Customizable and Professional Design: A sleek Excel template tailored to meet your valuation requirements.
- Designed for Analysts and Investors: Perfect for assessing projections, affirming strategies, and enhancing efficiency.
Key Features
- 🔍 Real-Life Capchem Financials: Pre-filled historical and projected data for Shenzhen Capchem Technology Co., Ltd. (300037SZ).
- ✏️ Fully Customizable Inputs: Modify all essential parameters (yellow cells) such as WACC, growth %, and tax rates.
- 📊 Professional DCF Valuation: Integrated formulas compute Capchem's intrinsic value utilizing the Discounted Cash Flow method.
- ⚡ Instant Results: Visualize Capchem’s valuation immediately after making adjustments.
- Scenario Analysis: Explore and compare different outcomes for various financial assumptions side-by-side.
How It Functions
- Step 1: Download the pre-built Excel template featuring Shenzhen Capchem Technology Co., Ltd.'s data.
- Step 2: Review the populated sheets to familiarize yourself with the essential metrics.
- Step 3: Modify forecasts and assumptions in the editable yellow cells (WACC, growth, margins).
- Step 4: Immediately access the recalculated results, including the intrinsic value of Shenzhen Capchem Technology Co., Ltd. (300037SZ).
- Step 5: Make well-informed investment choices or create reports based on the outputs.
Why Choose Capchem Technology Co., Ltd.?
- Save Time: Our tools are ready to use, allowing you to skip the lengthy setup.
- Enhance Accuracy: Access reliable financial data and formulas that minimize valuation errors.
- Completely Customizable: Adapt the model to align with your unique assumptions and forecasts.
- User-Friendly: Intuitive charts and outputs simplify the analysis of results.
- Endorsed by Professionals: Created for experts who prioritize accuracy and ease of use.
Who Can Benefit from This Product?
- Institutional Investors: Develop accurate and comprehensive valuation models for assessing portfolios involving Shenzhen Capchem Technology Co., Ltd. (300037SZ).
- Corporate Finance Departments: Evaluate various valuation scenarios to inform strategic decision-making within the organization.
- Consultants and Financial Advisors: Deliver precise valuation analysis for clients interested in investing in Shenzhen Capchem Technology Co., Ltd. (300037SZ).
- Academics and Students: Engage with real-world data to enhance learning and practice financial modeling techniques.
- Industry Analysts: Gain insights into the market valuation of technology firms like Shenzhen Capchem Technology Co., Ltd. (300037SZ).
What the Template Contains
- Historical Data: Includes Shenzhen Capchem Technology Co., Ltd.'s past financials and baseline forecasts.
- DCF and Levered DCF Models: Detailed templates to calculate Shenzhen Capchem Technology Co., Ltd.'s intrinsic value.
- WACC Sheet: Pre-built calculations for Weighted Average Cost of Capital.
- Editable Inputs: Modify key drivers such as growth rates, EBITDA percentages, and CAPEX assumptions.
- Quarterly and Annual Statements: A comprehensive breakdown of Shenzhen Capchem Technology Co., Ltd.'s financials.
- Interactive Dashboard: Dynamically visualize valuation results and projections.
Disclaimer
All information, articles, and product details provided on this website are for general informational and educational purposes only. We do not claim any ownership over, nor do we intend to infringe upon, any trademarks, copyrights, logos, brand names, or other intellectual property mentioned or depicted on this site. Such intellectual property remains the property of its respective owners, and any references here are made solely for identification or informational purposes, without implying any affiliation, endorsement, or partnership.
We make no representations or warranties, express or implied, regarding the accuracy, completeness, or suitability of any content or products presented. Nothing on this website should be construed as legal, tax, investment, financial, medical, or other professional advice. In addition, no part of this site—including articles or product references—constitutes a solicitation, recommendation, endorsement, advertisement, or offer to buy or sell any securities, franchises, or other financial instruments, particularly in jurisdictions where such activity would be unlawful.
All content is of a general nature and may not address the specific circumstances of any individual or entity. It is not a substitute for professional advice or services. Any actions you take based on the information provided here are strictly at your own risk. You accept full responsibility for any decisions or outcomes arising from your use of this website and agree to release us from any liability in connection with your use of, or reliance upon, the content or products found herein.