
|
Shanghai Kaibao Pharmaceutical Co., Ltd (300039.sz) DCF Valoración |
Completamente Editable: Adáptelo A Sus Necesidades En Excel O Sheets
Diseño Profesional: Plantillas Confiables Y Estándares De La Industria
Predeterminadas Para Un Uso Rápido Y Eficiente
Compatible con MAC / PC, completamente desbloqueado
No Se Necesita Experiencia; Fáciles De Seguir
Shanghai Kaibao Pharmaceutical CO.,Ltd (300039.SZ) Bundle
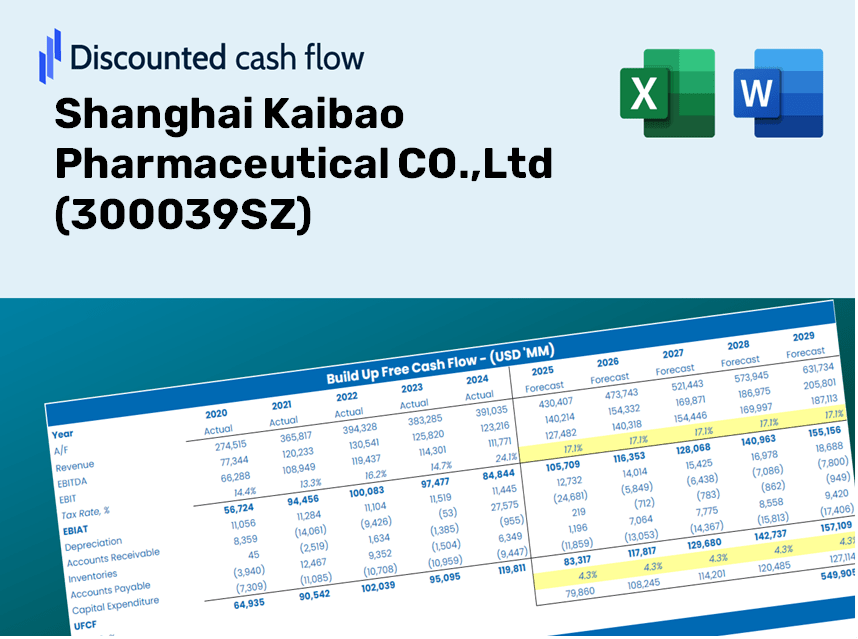
Ya sea que sea un inversor o analista, esta calculadora DCF (300039SZ) es su herramienta esencial para una valoración precisa. Viene precargado con datos reales de Shanghai Kaibao Pharmaceutical Co., Ltd, lo que le permite ajustar los pronósticos y observar los efectos en tiempo real.
Discounted Cash Flow (DCF) - (USD MM)
| Year | AY1 2020 |
AY2 2021 |
AY3 2022 |
AY4 2023 |
AY5 2024 |
FY1 2025 |
FY2 2026 |
FY3 2027 |
FY4 2028 |
FY5 2029 |
|---|---|---|---|---|---|---|---|---|---|---|
| Revenue | 908.0 | 1,100.6 | 1,118.9 | 1,594.1 | 1,473.3 | 1,686.1 | 1,929.6 | 2,208.3 | 2,527.2 | 2,892.1 |
| Revenue Growth, % | 0 | 21.21 | 1.66 | 42.47 | -7.57 | 14.44 | 14.44 | 14.44 | 14.44 | 14.44 |
| EBITDA | 172.9 | 203.7 | 257.9 | 367.5 | 470.3 | 389.7 | 446.0 | 510.4 | 584.2 | 668.5 |
| EBITDA, % | 19.04 | 18.5 | 23.05 | 23.06 | 31.92 | 23.12 | 23.12 | 23.12 | 23.12 | 23.12 |
| Depreciation | 41.0 | 33.9 | 31.7 | 37.5 | 36.1 | 51.4 | 58.8 | 67.3 | 77.0 | 88.1 |
| Depreciation, % | 4.52 | 3.08 | 2.83 | 2.35 | 2.45 | 3.05 | 3.05 | 3.05 | 3.05 | 3.05 |
| EBIT | 131.9 | 169.8 | 226.2 | 330.0 | 434.2 | 338.4 | 387.3 | 443.2 | 507.2 | 580.4 |
| EBIT, % | 14.53 | 15.43 | 20.22 | 20.7 | 29.47 | 20.07 | 20.07 | 20.07 | 20.07 | 20.07 |
| Total Cash | 1,421.7 | 1,396.2 | 830.8 | 752.0 | 773.3 | 1,260.9 | 1,443.0 | 1,651.4 | 1,889.9 | 2,162.8 |
| Total Cash, percent | .0 | .0 | .0 | .0 | .0 | .0 | .0 | .0 | .0 | .0 |
| Account Receivables | 561.7 | 614.8 | 566.1 | 533.5 | 472.1 | 788.5 | 902.4 | 1,032.7 | 1,181.8 | 1,352.5 |
| Account Receivables, % | 61.86 | 55.86 | 50.6 | 33.47 | 32.04 | 46.77 | 46.77 | 46.77 | 46.77 | 46.77 |
| Inventories | 191.5 | 165.1 | 160.8 | 171.8 | 187.9 | 249.5 | 285.6 | 326.8 | 374.0 | 428.0 |
| Inventories, % | 21.09 | 15 | 14.37 | 10.78 | 12.75 | 14.8 | 14.8 | 14.8 | 14.8 | 14.8 |
| Accounts Payable | 62.2 | 75.0 | 91.0 | 134.8 | 99.4 | 124.8 | 142.8 | 163.4 | 187.0 | 214.1 |
| Accounts Payable, % | 6.85 | 6.82 | 8.13 | 8.46 | 6.74 | 7.4 | 7.4 | 7.4 | 7.4 | 7.4 |
| Capital Expenditure | -13.9 | -42.5 | -31.6 | -29.1 | -140.5 | -66.1 | -75.6 | -86.5 | -99.0 | -113.3 |
| Capital Expenditure, % | -1.54 | -3.87 | -2.83 | -1.82 | -9.54 | -3.92 | -3.92 | -3.92 | -3.92 | -3.92 |
| Tax Rate, % | 13.5 | 13.5 | 13.5 | 13.5 | 13.5 | 13.5 | 13.5 | 13.5 | 13.5 | 13.5 |
| EBITAT | 106.4 | 140.2 | 190.8 | 282.1 | 375.6 | 284.0 | 325.0 | 371.9 | 425.6 | 487.1 |
| Depreciation | ||||||||||
| Changes in Account Receivables | ||||||||||
| Changes in Inventories | ||||||||||
| Changes in Accounts Payable | ||||||||||
| Capital Expenditure | ||||||||||
| UFCF | -557.5 | 117.7 | 259.9 | 356.0 | 281.0 | -83.4 | 176.3 | 201.7 | 230.8 | 264.2 |
| WACC, % | 4.66 | 4.66 | 4.66 | 4.66 | 4.66 | 4.66 | 4.66 | 4.66 | 4.66 | 4.66 |
| PV UFCF | ||||||||||
| SUM PV UFCF | 659.9 | |||||||||
| Long Term Growth Rate, % | 3.00 | |||||||||
| Free cash flow (T + 1) | 272 | |||||||||
| Terminal Value | 16,365 | |||||||||
| Present Terminal Value | 13,030 | |||||||||
| Enterprise Value | 13,690 | |||||||||
| Net Debt | -588 | |||||||||
| Equity Value | 14,278 | |||||||||
| Diluted Shares Outstanding, MM | 1,046 | |||||||||
| Equity Value Per Share | 13.65 |
What You'll Receive
- Customizable Excel Template: A fully adjustable Excel-based DCF Calculator featuring pre-loaded financial data for Shanghai Kaibao Pharmaceutical CO., Ltd (300039SZ).
- Actual Market Data: Access to historical figures and future projections (indicated in the highlighted cells).
- Flexible Forecasting: Modify key assumptions such as revenue growth, EBITDA margin, and WACC.
- Instant Calculations: Immediately observe how your adjustments affect the valuation of Shanghai Kaibao Pharmaceutical CO., Ltd (300039SZ).
- Professional Resource: Designed for investors, CFOs, consultants, and financial analysts alike.
- User-Friendly Layout: Organized for straightforward navigation and enhanced usability, complete with step-by-step guidance.
Key Features
- Comprehensive Valuation Tool: Features detailed unlevered and levered DCF valuation models tailored for Shanghai Kaibao Pharmaceutical CO.,Ltd (300039SZ).
- WACC Calculator: Comes with a pre-configured Weighted Average Cost of Capital sheet that allows for customizable inputs specific to the pharmaceutical sector.
- Customizable Forecast Assumptions: Adjust growth projections, capital investment estimates, and discount rates to align with market trends.
- Integrated Financial Ratios: Evaluate key profitability, leverage, and efficiency benchmarks for Shanghai Kaibao Pharmaceutical CO.,Ltd (300039SZ).
- Visual Dashboard and Charts: Offers graphical representations that highlight essential valuation metrics for straightforward analysis.
How It Works
- Step 1: Download the prebuilt Excel template containing data for Shanghai Kaibao Pharmaceutical Co., Ltd (300039SZ).
- Step 2: Browse through the pre-filled sheets to familiarize yourself with the essential metrics.
- Step 3: Update your forecasts and assumptions in the editable yellow cells (WACC, growth rates, and margins).
- Step 4: Instantly see the recalculated outcomes, including the intrinsic value for Shanghai Kaibao Pharmaceutical Co., Ltd (300039SZ).
- Step 5: Make informed investment choices or create reports based on the generated outputs.
Why Opt for Shanghai Kaibao Pharmaceutical CO., Ltd's Calculator?
- Time-Saving: Skip the hassle of building a DCF model from the ground up – it's ready for your use.
- Enhanced Accuracy: With dependable financial data and formulas, minimize valuation errors.
- Completely Customizable: Adjust the model to suit your specific assumptions and forecasts.
- User-Friendly: Intuitive charts and outputs simplify the analysis of results.
- Endorsed by Professionals: Crafted for those who prioritize precision and ease of use.
Who Should Use This Product?
- Individual Investors: Make informed decisions about buying or selling shares of Shanghai Kaibao Pharmaceutical CO.,Ltd (300039SZ).
- Financial Analysts: Enhance valuation processes with ready-to-use financial models tailored for Shanghai Kaibao Pharmaceutical CO.,Ltd (300039SZ).
- Consultants: Provide professional valuation insights to clients efficiently and accurately for Shanghai Kaibao Pharmaceutical CO.,Ltd (300039SZ).
- Business Owners: Gain an understanding of how major companies like Shanghai Kaibao Pharmaceutical CO.,Ltd (300039SZ) are valued to inform your strategic decisions.
- Finance Students: Discover valuation techniques using real-world data and scenarios relevant to Shanghai Kaibao Pharmaceutical CO.,Ltd (300039SZ).
Contents of the Template
- Pre-Filled Data: Contains Shanghai Kaibao Pharmaceutical's historical financials and projections.
- Discounted Cash Flow Model: Interactive DCF valuation model with automated calculations.
- Weighted Average Cost of Capital (WACC): A dedicated section for WACC computation based on user-defined inputs.
- Key Financial Ratios: Assess the profitability, efficiency, and leverage of Shanghai Kaibao Pharmaceutical.
- Customizable Inputs: Easily modify revenue growth rates, margins, and tax percentages.
- Comprehensive Dashboard: Visual summary of key valuation outcomes through charts and tables.
Disclaimer
All information, articles, and product details provided on this website are for general informational and educational purposes only. We do not claim any ownership over, nor do we intend to infringe upon, any trademarks, copyrights, logos, brand names, or other intellectual property mentioned or depicted on this site. Such intellectual property remains the property of its respective owners, and any references here are made solely for identification or informational purposes, without implying any affiliation, endorsement, or partnership.
We make no representations or warranties, express or implied, regarding the accuracy, completeness, or suitability of any content or products presented. Nothing on this website should be construed as legal, tax, investment, financial, medical, or other professional advice. In addition, no part of this site—including articles or product references—constitutes a solicitation, recommendation, endorsement, advertisement, or offer to buy or sell any securities, franchises, or other financial instruments, particularly in jurisdictions where such activity would be unlawful.
All content is of a general nature and may not address the specific circumstances of any individual or entity. It is not a substitute for professional advice or services. Any actions you take based on the information provided here are strictly at your own risk. You accept full responsibility for any decisions or outcomes arising from your use of this website and agree to release us from any liability in connection with your use of, or reliance upon, the content or products found herein.