
|
Hiconics Eco-Ennergy Technology Co., Ltd. (300048.SZ) Valoración de DCF |
Completamente Editable: Adáptelo A Sus Necesidades En Excel O Sheets
Diseño Profesional: Plantillas Confiables Y Estándares De La Industria
Predeterminadas Para Un Uso Rápido Y Eficiente
Compatible con MAC / PC, completamente desbloqueado
No Se Necesita Experiencia; Fáciles De Seguir
Hiconics Eco-energy Technology Co., Ltd. (300048.SZ) Bundle
¡Obtenga información sobre su análisis de valoración de Hiconics Eco-Ennergy Co., Ltd. (300048SZ) con nuestra sofisticada calculadora DCF! Equipado con datos reales (300048SZ), esta plantilla de Excel le permite ajustar los pronósticos y los supuestos para determinar con precisión el valor intrínseco de Hiconics Eco-Energy Technology Co., Ltd.
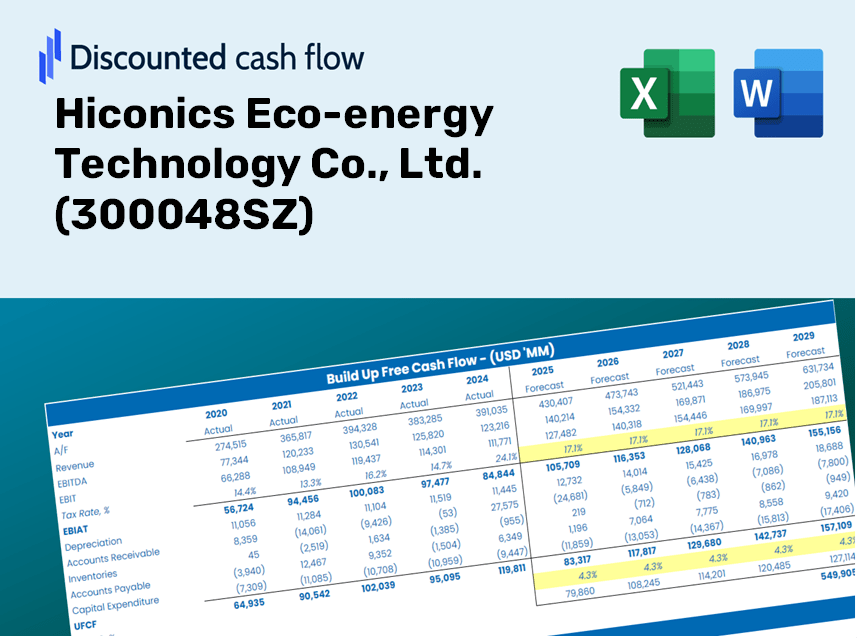
Discounted Cash Flow (DCF) - (USD MM)
| Year | AY1 2020 |
AY2 2021 |
AY3 2022 |
AY4 2023 |
AY5 2024 |
FY1 2025 |
FY2 2026 |
FY3 2027 |
FY4 2028 |
FY5 2029 |
|---|---|---|---|---|---|---|---|---|---|---|
| Revenue | 1,256.6 | 1,204.2 | 1,423.8 | 1,491.2 | 4,776.4 | 6,194.9 | 8,034.8 | 10,421.1 | 13,516.2 | 17,530.5 |
| Revenue Growth, % | 0 | -4.17 | 18.23 | 4.73 | 220.31 | 29.7 | 29.7 | 29.7 | 29.7 | 29.7 |
| EBITDA | -160.8 | 135.5 | 91.3 | -110.9 | 110.7 | -3.0 | -3.9 | -5.0 | -6.5 | -8.5 |
| EBITDA, % | -12.8 | 11.26 | 6.41 | -7.44 | 2.32 | -0.04842572 | -0.04842572 | -0.04842572 | -0.04842572 | -0.04842572 |
| Depreciation | 114.4 | 69.2 | 59.9 | 60.5 | 73.4 | 305.4 | 396.1 | 513.7 | 666.3 | 864.2 |
| Depreciation, % | 9.1 | 5.74 | 4.21 | 4.06 | 1.54 | 4.93 | 4.93 | 4.93 | 4.93 | 4.93 |
| EBIT | -275.2 | 66.4 | 31.4 | -171.4 | 37.3 | -308.4 | -400.0 | -518.8 | -672.9 | -872.7 |
| EBIT, % | -21.9 | 5.51 | 2.21 | -11.49 | 0.78082 | -4.98 | -4.98 | -4.98 | -4.98 | -4.98 |
| Total Cash | 225.1 | 294.1 | 523.6 | 668.2 | 1,250.7 | 1,859.8 | 2,412.2 | 3,128.6 | 4,057.7 | 5,262.9 |
| Total Cash, percent | .0 | .0 | .0 | .0 | .0 | .0 | .0 | .0 | .0 | .0 |
| Account Receivables | 880.9 | 667.0 | 938.3 | 1,009.7 | 1,278.3 | 3,541.9 | 4,593.9 | 5,958.2 | 7,727.8 | 10,023.0 |
| Account Receivables, % | 70.11 | 55.39 | 65.9 | 67.72 | 26.76 | 57.17 | 57.17 | 57.17 | 57.17 | 57.17 |
| Inventories | 370.0 | 283.0 | 273.6 | 418.4 | 995.0 | 1,499.8 | 1,945.2 | 2,522.9 | 3,272.2 | 4,244.0 |
| Inventories, % | 29.44 | 23.5 | 19.21 | 28.06 | 20.83 | 24.21 | 24.21 | 24.21 | 24.21 | 24.21 |
| Accounts Payable | 385.5 | 349.5 | 450.0 | 1,056.1 | 1,194.2 | 2,318.5 | 3,007.1 | 3,900.3 | 5,058.6 | 6,561.0 |
| Accounts Payable, % | 30.68 | 29.02 | 31.6 | 70.83 | 25 | 37.43 | 37.43 | 37.43 | 37.43 | 37.43 |
| Capital Expenditure | -75.7 | -41.8 | -30.2 | -38.3 | -55.4 | -190.0 | -246.5 | -319.7 | -414.7 | -537.8 |
| Capital Expenditure, % | -6.02 | -3.47 | -2.12 | -2.57 | -1.16 | -3.07 | -3.07 | -3.07 | -3.07 | -3.07 |
| Tax Rate, % | 79.25 | 79.25 | 79.25 | 79.25 | 79.25 | 79.25 | 79.25 | 79.25 | 79.25 | 79.25 |
| EBITAT | -230.9 | 66.3 | 16.8 | -172.4 | 7.7 | -220.9 | -286.5 | -371.6 | -481.9 | -625.0 |
| Depreciation | ||||||||||
| Changes in Account Receivables | ||||||||||
| Changes in Inventories | ||||||||||
| Changes in Accounts Payable | ||||||||||
| Capital Expenditure | ||||||||||
| UFCF | -1,057.6 | 358.6 | -114.9 | 239.7 | -681.2 | -1,749.6 | -945.6 | -1,226.5 | -1,590.7 | -2,063.2 |
| WACC, % | 4.68 | 4.69 | 4.65 | 4.69 | 4.63 | 4.67 | 4.67 | 4.67 | 4.67 | 4.67 |
| PV UFCF | ||||||||||
| SUM PV UFCF | -6,572.3 | |||||||||
| Long Term Growth Rate, % | 4.00 | |||||||||
| Free cash flow (T + 1) | -2,146 | |||||||||
| Terminal Value | -321,723 | |||||||||
| Present Terminal Value | -256,115 | |||||||||
| Enterprise Value | -262,687 | |||||||||
| Net Debt | -1,215 | |||||||||
| Equity Value | -261,472 | |||||||||
| Diluted Shares Outstanding, MM | 1,116 | |||||||||
| Equity Value Per Share | -234.26 |
What You Will Receive
- Genuine Hiconics Financials: Access to both historical and projected data for precise valuation.
- Customizable Inputs: Adjust parameters such as WACC, tax rates, revenue growth, and capital expenditures.
- Real-time Calculations: Dynamic computation of intrinsic value and NPV.
- Scenario Testing: Analyze various scenarios to assess Hiconics' future performance.
- User-Friendly Interface: Designed for professionals while remaining easy for newcomers to navigate.
Key Features
- Advanced DCF Calculator: Features comprehensive unlevered and levered DCF valuation models tailored for Hiconics Eco-energy Technology Co., Ltd. (300048SZ).
- WACC Calculator: Comes with a pre-built Weighted Average Cost of Capital sheet, allowing for customizable inputs specific to industry needs.
- Editable Forecast Assumptions: Easily adjust growth rates, capital expenditures, and discount rates to fit your financial projections.
- Built-In Financial Ratios: Evaluate profitability, leverage, and efficiency metrics specifically for Hiconics Eco-energy Technology Co., Ltd. (300048SZ).
- Dashboard and Charts: Interactive visualizations that summarize key valuation metrics, facilitating straightforward analysis.
How It Functions
- Download: Obtain the pre-prepared Excel file featuring Hiconics Eco-energy Technology Co., Ltd.'s financial data (300048SZ).
- Customize: Tailor forecasts, such as revenue growth, EBITDA %, and WACC to your needs.
- Update Automatically: Intrinsic value and NPV calculations refresh in real-time.
- Test Scenarios: Develop various projections and instantly compare the results.
- Make Decisions: Leverage the valuation outcomes to inform your investment strategy.
Why Choose Hiconics Eco-energy Technology Calculator?
- Precision: Utilizes actual financial data from Hiconics to ensure precision.
- Adaptability: Built to allow users to easily test and adjust inputs as needed.
- Efficiency: Bypass the complications of creating a financial model from the ground up.
- Expert-Level: Crafted with the accuracy and functionality expected at the executive level.
- Intuitive: Simple interface, suitable for users with varying levels of financial modeling skills.
Who Would Benefit from This Product?
- Investors: Evaluate Hiconics Eco-energy Technology Co., Ltd.'s (300048SZ) valuation prior to making investment decisions.
- CFOs and Financial Analysts: Enhance valuation methodologies and assess financial forecasts.
- Startup Founders: Discover how large public companies like Hiconics are valued in the market.
- Consultants: Provide comprehensive valuation reports for your clientele.
- Students and Educators: Utilize real data to learn and teach valuation strategies effectively.
Contents of the Template
- Detailed DCF Model: An editable template featuring intricate valuation calculations.
- Real Data Insights: Hiconics Eco-energy Technology Co., Ltd.’s (300048SZ) historical and projected financial data preloaded for thorough analysis.
- Customizable Assumptions: Modify WACC, growth rates, and tax estimates to explore various scenarios.
- Comprehensive Financial Statements: Complete annual and quarterly breakdowns for enhanced understanding.
- Essential Ratios: Integrated analysis for profitability, efficiency, and leverage metrics.
- Interactive Dashboard with Visual Outputs: Charts and tables designed to provide clear, actionable insights.
Disclaimer
All information, articles, and product details provided on this website are for general informational and educational purposes only. We do not claim any ownership over, nor do we intend to infringe upon, any trademarks, copyrights, logos, brand names, or other intellectual property mentioned or depicted on this site. Such intellectual property remains the property of its respective owners, and any references here are made solely for identification or informational purposes, without implying any affiliation, endorsement, or partnership.
We make no representations or warranties, express or implied, regarding the accuracy, completeness, or suitability of any content or products presented. Nothing on this website should be construed as legal, tax, investment, financial, medical, or other professional advice. In addition, no part of this site—including articles or product references—constitutes a solicitation, recommendation, endorsement, advertisement, or offer to buy or sell any securities, franchises, or other financial instruments, particularly in jurisdictions where such activity would be unlawful.
All content is of a general nature and may not address the specific circumstances of any individual or entity. It is not a substitute for professional advice or services. Any actions you take based on the information provided here are strictly at your own risk. You accept full responsibility for any decisions or outcomes arising from your use of this website and agree to release us from any liability in connection with your use of, or reliance upon, the content or products found herein.