
|
Xiamen Zhongchuang Environmental Technology Co., Ltd (300056.SZ) Valoración de DCF |
Completamente Editable: Adáptelo A Sus Necesidades En Excel O Sheets
Diseño Profesional: Plantillas Confiables Y Estándares De La Industria
Predeterminadas Para Un Uso Rápido Y Eficiente
Compatible con MAC / PC, completamente desbloqueado
No Se Necesita Experiencia; Fáciles De Seguir
Xiamen Zhongchuang Environmental Technology Co., Ltd (300056.SZ) Bundle
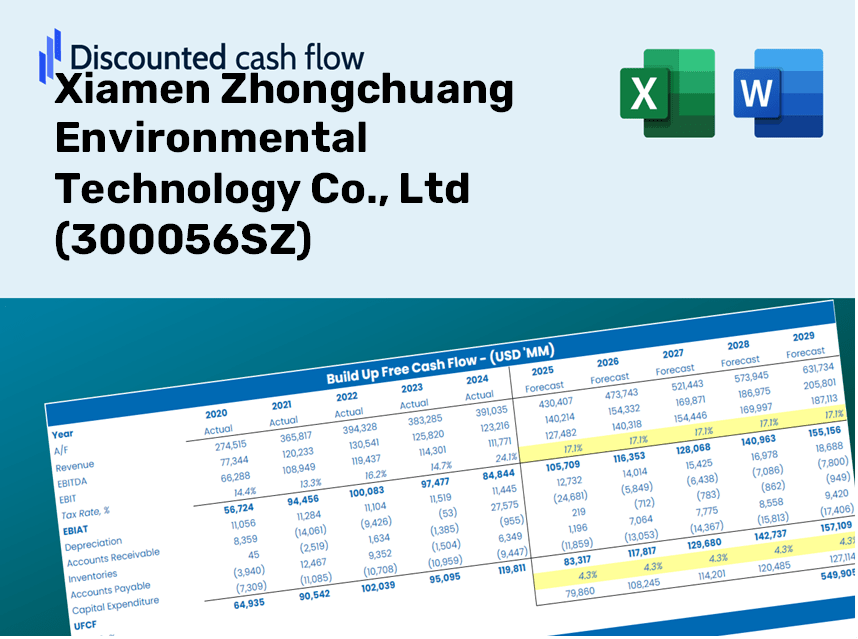
Diseñada para la precisión, nuestra calculadora DCF (300056SZ) le permite evaluar Xiamen Zhongchuang Environmental Technology Co., la valoración de LTD utilizando datos financieros del mundo real, proporcionando una flexibilidad completa para modificar todos los parámetros esenciales para mejorar las proyecciones.
Discounted Cash Flow (DCF) - (USD MM)
| Year | AY1 2020 |
AY2 2021 |
AY3 2022 |
AY4 2023 |
AY5 2024 |
FY1 2025 |
FY2 2026 |
FY3 2027 |
FY4 2028 |
FY5 2029 |
|---|---|---|---|---|---|---|---|---|---|---|
| Revenue | 1,824.4 | 1,142.0 | 1,007.1 | 515.1 | 466.0 | 340.6 | 249.0 | 182.0 | 133.1 | 97.3 |
| Revenue Growth, % | 0 | -37.4 | -11.81 | -48.85 | -9.54 | -26.9 | -26.9 | -26.9 | -26.9 | -26.9 |
| EBITDA | 106.2 | 7.0 | -39.5 | -111.2 | -67.8 | -22.9 | -16.7 | -12.2 | -8.9 | -6.5 |
| EBITDA, % | 5.82 | 0.61409 | -3.92 | -21.6 | -14.54 | -6.72 | -6.72 | -6.72 | -6.72 | -6.72 |
| Depreciation | 50.4 | 50.3 | 50.0 | 51.7 | 41.6 | 21.2 | 15.5 | 11.3 | 8.3 | 6.0 |
| Depreciation, % | 2.76 | 4.4 | 4.97 | 10.05 | 8.92 | 6.22 | 6.22 | 6.22 | 6.22 | 6.22 |
| EBIT | 55.9 | -43.3 | -89.5 | -163.0 | -109.3 | -44.1 | -32.2 | -23.6 | -17.2 | -12.6 |
| EBIT, % | 3.06 | -3.79 | -8.89 | -31.64 | -23.46 | -12.94 | -12.94 | -12.94 | -12.94 | -12.94 |
| Total Cash | 278.9 | 110.1 | 67.9 | 25.6 | 44.2 | 31.4 | 23.0 | 16.8 | 12.3 | 9.0 |
| Total Cash, percent | .0 | .0 | .0 | .0 | .0 | .0 | .0 | .0 | .0 | .0 |
| Account Receivables | 436.2 | 287.1 | 300.0 | 264.3 | 288.3 | 130.8 | 95.6 | 69.9 | 51.1 | 37.4 |
| Account Receivables, % | 23.91 | 25.14 | 29.79 | 51.31 | 61.86 | 38.4 | 38.4 | 38.4 | 38.4 | 38.4 |
| Inventories | 315.7 | 315.1 | 207.9 | 205.2 | 69.8 | 82.0 | 59.9 | 43.8 | 32.0 | 23.4 |
| Inventories, % | 17.31 | 27.59 | 20.64 | 39.83 | 14.98 | 24.07 | 24.07 | 24.07 | 24.07 | 24.07 |
| Accounts Payable | 176.6 | 151.9 | 207.0 | 149.1 | 14.4 | 51.5 | 37.6 | 27.5 | 20.1 | 14.7 |
| Accounts Payable, % | 9.68 | 13.3 | 20.56 | 28.95 | 3.08 | 15.11 | 15.11 | 15.11 | 15.11 | 15.11 |
| Capital Expenditure | -25.9 | -64.7 | -42.6 | -16.2 | -10.3 | -11.4 | -8.3 | -6.1 | -4.4 | -3.2 |
| Capital Expenditure, % | -1.42 | -5.67 | -4.23 | -3.15 | -2.21 | -3.34 | -3.34 | -3.34 | -3.34 | -3.34 |
| Tax Rate, % | 15.03 | 15.03 | 15.03 | 15.03 | 15.03 | 15.03 | 15.03 | 15.03 | 15.03 | 15.03 |
| EBITAT | 24.9 | -44.3 | -60.6 | -132.9 | -92.9 | -33.4 | -24.4 | -17.8 | -13.0 | -9.5 |
| Depreciation | ||||||||||
| Changes in Account Receivables | ||||||||||
| Changes in Inventories | ||||||||||
| Changes in Accounts Payable | ||||||||||
| Capital Expenditure | ||||||||||
| UFCF | -526.0 | 66.3 | 96.3 | -116.9 | -85.0 | 158.8 | 26.2 | 19.1 | 14.0 | 10.2 |
| WACC, % | 6.32 | 6.56 | 6.42 | 6.48 | 6.49 | 6.45 | 6.45 | 6.45 | 6.45 | 6.45 |
| PV UFCF | ||||||||||
| SUM PV UFCF | 206.5 | |||||||||
| Long Term Growth Rate, % | 4.00 | |||||||||
| Free cash flow (T + 1) | 11 | |||||||||
| Terminal Value | 433 | |||||||||
| Present Terminal Value | 317 | |||||||||
| Enterprise Value | 524 | |||||||||
| Net Debt | 166 | |||||||||
| Equity Value | 357 | |||||||||
| Diluted Shares Outstanding, MM | 390 | |||||||||
| Equity Value Per Share | 0.92 |
What You Will Receive
- Authentic Xiamen Zhongchuang Data: Comprehensive financials – covering everything from revenue to EBIT – based on actual and forecasted data.
- Complete Customization: Modify key parameters (highlighted cells) such as WACC, growth rate, and tax percentages.
- Instant Valuation Adjustments: Automatic recalculations to evaluate the effects of changes on the fair value of Xiamen Zhongchuang (300056SZ).
- Flexible Excel Template: Designed for swift modifications, scenario analysis, and in-depth projections.
- Efficient and Precise: Avoid the hassle of building models from the ground up while ensuring accuracy and adaptability.
Key Features
- Accurate Financial Data for Xiamen Zhongchuang: Gain access to reliable pre-loaded historical figures and future forecasts.
- Customizable Forecast Inputs: Easily modify highlighted cells for parameters like WACC, growth rates, and profit margins.
- Real-Time Calculations: Enjoy automatic updates for DCF, Net Present Value (NPV), and cash flow assessments.
- Interactive Dashboard: Utilize user-friendly charts and summaries to present your valuation findings clearly.
- Designed for All Users: An intuitive format tailored for investors, CFOs, and consultants, whether you’re a novice or an expert.
How It Operates
- Download: Get the preformatted Excel file containing the financial data for Xiamen Zhongchuang Environmental Technology Co., Ltd (300056SZ).
- Customize: Modify forecasts, including revenue growth, EBITDA %, and WACC as per your requirements.
- Update Automatically: Watch as the intrinsic value and NPV calculations refresh in real-time.
- Test Scenarios: Generate various projections and instantly analyze the different outcomes.
- Make Decisions: Leverage the valuation results to inform your investment approach.
Why Choose Xiamen Zhongchuang Environmental Technology Co., Ltd (300056SZ)?
- Precision: Rely on accurate and up-to-date environmental data.
- Adaptability: Tailored for users to easily adjust and explore various parameters.
- Efficiency: Eliminate the need for complex calculations by utilizing our streamlined tools.
- Expert-Level: Crafted with insights from industry leaders to ensure top-notch quality and functionality.
- Intuitive Design: User-friendly interface suitable for individuals at all skill levels in environmental technology.
Who Can Benefit from Our Solutions?
- Investors: Gain the confidence to make informed decisions with our cutting-edge environmental technology analysis tools.
- Environmental Analysts: Streamline your workflow with a customizable model tailored to sustainability metrics.
- Consultants: Efficiently modify our templates for impactful client presentations or reports in the environmental sector.
- Green Tech Enthusiasts: Enhance your knowledge of environmental valuation practices through real-world case studies.
- Educators and Students: Leverage our resources as a hands-on learning tool in courses focused on environmental technology.
Contents of the Template
- Pre-Filled DCF Model: Xiamen Zhongchuang Environmental Technology Co., Ltd (300056SZ) financial data preloaded for immediate application.
- WACC Calculator: Comprehensive calculations for the Weighted Average Cost of Capital.
- Financial Ratios: Assess Xiamen Zhongchuang's profitability, leverage, and operational efficiency.
- Editable Inputs: Modify assumptions such as growth rates, margins, and CAPEX to tailor-fit your scenarios.
- Financial Statements: Annual and quarterly reports available for in-depth analysis.
- Interactive Dashboard: Effortlessly visualize key valuation metrics and outcomes.
Disclaimer
All information, articles, and product details provided on this website are for general informational and educational purposes only. We do not claim any ownership over, nor do we intend to infringe upon, any trademarks, copyrights, logos, brand names, or other intellectual property mentioned or depicted on this site. Such intellectual property remains the property of its respective owners, and any references here are made solely for identification or informational purposes, without implying any affiliation, endorsement, or partnership.
We make no representations or warranties, express or implied, regarding the accuracy, completeness, or suitability of any content or products presented. Nothing on this website should be construed as legal, tax, investment, financial, medical, or other professional advice. In addition, no part of this site—including articles or product references—constitutes a solicitation, recommendation, endorsement, advertisement, or offer to buy or sell any securities, franchises, or other financial instruments, particularly in jurisdictions where such activity would be unlawful.
All content is of a general nature and may not address the specific circumstances of any individual or entity. It is not a substitute for professional advice or services. Any actions you take based on the information provided here are strictly at your own risk. You accept full responsibility for any decisions or outcomes arising from your use of this website and agree to release us from any liability in connection with your use of, or reliance upon, the content or products found herein.