
|
Gosuncn Technology Group Co., Ltd. (300098.SZ) Valoración de DCF |
Completamente Editable: Adáptelo A Sus Necesidades En Excel O Sheets
Diseño Profesional: Plantillas Confiables Y Estándares De La Industria
Predeterminadas Para Un Uso Rápido Y Eficiente
Compatible con MAC / PC, completamente desbloqueado
No Se Necesita Experiencia; Fáciles De Seguir
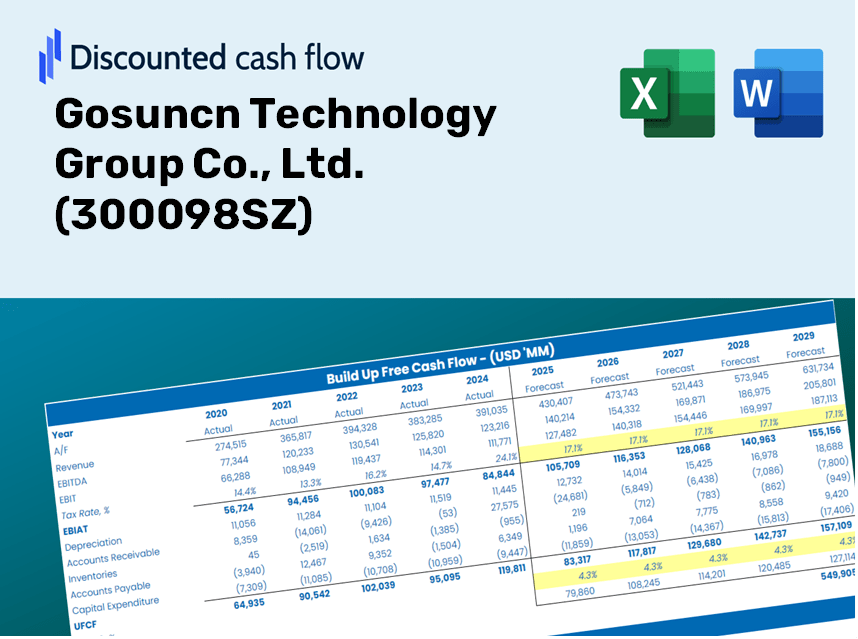
Gosuncn Technology Group Co., Ltd. (300098.SZ) Bundle
¡Agilice su análisis y mejore la precisión con nuestra calculadora DCF (300098SZ)! Utilizando datos reales de Gosuncn Technology Group Co., Ltd. y suposiciones personalizables, esta herramienta le permite pronosticar, evaluar y evaluar (300098SZ) al igual que un inversor experimentado.
Discounted Cash Flow (DCF) - (USD MM)
| Year | AY1 2020 |
AY2 2021 |
AY3 2022 |
AY4 2023 |
AY5 2024 |
FY1 2025 |
FY2 2026 |
FY3 2027 |
FY4 2028 |
FY5 2029 |
|---|---|---|---|---|---|---|---|---|---|---|
| Revenue | 2,326.1 | 2,672.9 | 2,332.9 | 1,798.8 | 1,416.7 | 1,268.1 | 1,135.1 | 1,016.1 | 909.5 | 814.2 |
| Revenue Growth, % | 0 | 14.91 | -12.72 | -22.89 | -21.24 | -10.49 | -10.49 | -10.49 | -10.49 | -10.49 |
| EBITDA | -501.1 | -41.4 | -238.3 | -113.7 | -269.5 | -148.8 | -133.2 | -119.2 | -106.7 | -95.5 |
| EBITDA, % | -21.54 | -1.55 | -10.21 | -6.32 | -19.02 | -11.73 | -11.73 | -11.73 | -11.73 | -11.73 |
| Depreciation | 86.4 | 65.8 | 50.3 | 36.2 | 24.6 | 30.6 | 27.4 | 24.6 | 22.0 | 19.7 |
| Depreciation, % | 3.72 | 2.46 | 2.16 | 2.01 | 1.73 | 2.42 | 2.42 | 2.42 | 2.42 | 2.42 |
| EBIT | -587.5 | -107.2 | -288.6 | -149.9 | -294.1 | -179.4 | -160.6 | -143.8 | -128.7 | -115.2 |
| EBIT, % | -25.26 | -4.01 | -12.37 | -8.33 | -20.76 | -14.15 | -14.15 | -14.15 | -14.15 | -14.15 |
| Total Cash | 1,047.2 | 779.7 | 592.2 | 551.8 | 521.5 | 423.7 | 379.3 | 339.5 | 303.9 | 272.0 |
| Total Cash, percent | .0 | .0 | .0 | .0 | .0 | .0 | .0 | .0 | .0 | .0 |
| Account Receivables | 2,066.5 | 2,133.3 | 2,187.9 | 1,972.3 | 1,692.5 | 1,172.9 | 1,049.9 | 939.8 | 841.2 | 753.0 |
| Account Receivables, % | 88.84 | 79.81 | 93.78 | 109.64 | 119.47 | 92.49 | 92.49 | 92.49 | 92.49 | 92.49 |
| Inventories | 687.3 | 696.7 | 482.6 | 397.8 | 417.4 | 324.3 | 290.3 | 259.9 | 232.6 | 208.2 |
| Inventories, % | 29.55 | 26.06 | 20.68 | 22.12 | 29.46 | 25.57 | 25.57 | 25.57 | 25.57 | 25.57 |
| Accounts Payable | 1,386.8 | 1,334.8 | 1,183.9 | 922.4 | 1,061.5 | 726.7 | 650.5 | 582.3 | 521.2 | 466.5 |
| Accounts Payable, % | 59.62 | 49.94 | 50.75 | 51.28 | 74.93 | 57.3 | 57.3 | 57.3 | 57.3 | 57.3 |
| Capital Expenditure | -84.8 | -52.8 | -152.8 | -266.5 | -128.8 | -91.5 | -81.9 | -73.3 | -65.6 | -58.7 |
| Capital Expenditure, % | -3.64 | -1.97 | -6.55 | -14.81 | -9.09 | -7.21 | -7.21 | -7.21 | -7.21 | -7.21 |
| Tax Rate, % | -5.06 | -5.06 | -5.06 | -5.06 | -5.06 | -5.06 | -5.06 | -5.06 | -5.06 | -5.06 |
| EBITAT | -542.9 | -241.9 | -302.3 | -147.5 | -309.0 | -176.1 | -157.6 | -141.1 | -126.3 | -113.1 |
| Depreciation | ||||||||||
| Changes in Account Receivables | ||||||||||
| Changes in Inventories | ||||||||||
| Changes in Accounts Payable | ||||||||||
| Capital Expenditure | ||||||||||
| UFCF | -1,908.2 | -357.0 | -396.2 | -339.0 | -13.8 | 40.9 | -131.3 | -117.5 | -105.2 | -94.2 |
| WACC, % | 6.04 | 6.05 | 6.05 | 6.04 | 6.05 | 6.04 | 6.04 | 6.04 | 6.04 | 6.04 |
| PV UFCF | ||||||||||
| SUM PV UFCF | -330.1 | |||||||||
| Long Term Growth Rate, % | 2.00 | |||||||||
| Free cash flow (T + 1) | -96 | |||||||||
| Terminal Value | -2,375 | |||||||||
| Present Terminal Value | -1,771 | |||||||||
| Enterprise Value | -2,101 | |||||||||
| Net Debt | -313 | |||||||||
| Equity Value | -1,788 | |||||||||
| Diluted Shares Outstanding, MM | 1,691 | |||||||||
| Equity Value Per Share | -1.06 |
Benefits You Will Receive
- Customizable Excel Template: A fully adjustable Excel-based DCF Calculator featuring pre-filled real financial data for Gosuncn Technology Group Co., Ltd. (300098SZ).
- Accurate Market Data: Access to historical figures and future projections (highlighted in the yellow cells).
- Flexible Forecasting: Adjust projections for revenue growth, EBITDA percentages, and WACC as needed.
- Instant Calculations: Quickly assess how your inputs affect the valuation of Gosuncn Technology Group Co., Ltd. (300098SZ).
- Professional Grade Tool: Designed for investors, CFOs, consultants, and financial analysts.
- Intuitive Layout: Organized for easy navigation and understanding, complete with step-by-step guidance.
Key Features
- Pre-Loaded Data: Gosuncn Technology Group Co., Ltd.'s historical financial statements and pre-filled forecasts.
- Fully Adjustable Inputs: Customize WACC, tax rates, revenue growth, and EBITDA margins.
- Instant Results: Observe the intrinsic value of Gosuncn Technology Group Co., Ltd. recalculating in real time.
- Clear Visual Outputs: Dashboard charts present valuation results and essential metrics.
- Built for Accuracy: A professional tool designed for analysts, investors, and finance professionals.
How It Functions
- 1. Access the Template: Download and open the Excel file containing Gosuncn Technology Group Co., Ltd.'s preloaded data.
- 2. Modify Assumptions: Adjust key variables such as growth rates, WACC, and capital expenditures.
- 3. Instant Results: The DCF model automatically computes intrinsic value and NPV.
- 4. Experiment with Scenarios: Evaluate various forecasts to explore different valuation results.
- 5. Present with Assurance: Deliver professional valuation insights to bolster your decision-making process.
Why Opt for Gosuncn Technology Group Co., Ltd. (300098SZ)?
- Streamline Your Process: No need to build a financial model from the ground up – it’s pre-configured for immediate use.
- Enhance Precision: Trustworthy financial data and calculations minimize valuation discrepancies.
- Completely Adaptable: Customize the model to align with your unique assumptions and forecasts.
- Intuitive Analysis: Simple visuals and outputs facilitate easy interpretation of results.
- Endorsed by Professionals: Crafted for experts who prioritize accuracy and functionality.
Who Can Benefit from Gosuncn Technology Group Co., Ltd. (300098SZ) Solutions?
- Investors: Make informed choices with our advanced analysis tools tailored for the market.
- Financial Analysts: Streamline your workflow with customizable financial models designed for efficiency.
- Consultants: Effortlessly modify our resources for impactful client presentations and reports.
- Finance Enthusiasts: Enhance your knowledge of market strategies through practical, real-life case studies.
- Educators and Students: Utilize our materials as effective learning aids in finance courses.
Contents of the Template
- Comprehensive DCF Model: Fully editable template featuring intricate valuation calculations.
- Real-World Data: Preloaded historical and projected financial data for Gosuncn Technology Group Co., Ltd. (300098SZ) to facilitate analysis.
- Customizable Parameters: Modify WACC, growth rates, and tax assumptions to explore various scenarios.
- Financial Statements: Detailed annual and quarterly financial breakdowns for in-depth insights.
- Key Ratios: Integrated analysis of profitability, efficiency, and leverage metrics.
- Dashboard with Visual Outputs: Accessible charts and tables providing clear, actionable insights.
Disclaimer
All information, articles, and product details provided on this website are for general informational and educational purposes only. We do not claim any ownership over, nor do we intend to infringe upon, any trademarks, copyrights, logos, brand names, or other intellectual property mentioned or depicted on this site. Such intellectual property remains the property of its respective owners, and any references here are made solely for identification or informational purposes, without implying any affiliation, endorsement, or partnership.
We make no representations or warranties, express or implied, regarding the accuracy, completeness, or suitability of any content or products presented. Nothing on this website should be construed as legal, tax, investment, financial, medical, or other professional advice. In addition, no part of this site—including articles or product references—constitutes a solicitation, recommendation, endorsement, advertisement, or offer to buy or sell any securities, franchises, or other financial instruments, particularly in jurisdictions where such activity would be unlawful.
All content is of a general nature and may not address the specific circumstances of any individual or entity. It is not a substitute for professional advice or services. Any actions you take based on the information provided here are strictly at your own risk. You accept full responsibility for any decisions or outcomes arising from your use of this website and agree to release us from any liability in connection with your use of, or reliance upon, the content or products found herein.