
|
Ningbo Shuanglin Auto Parts Co., Ltd. (300100.sz) Valoración de DCF |
Completamente Editable: Adáptelo A Sus Necesidades En Excel O Sheets
Diseño Profesional: Plantillas Confiables Y Estándares De La Industria
Predeterminadas Para Un Uso Rápido Y Eficiente
Compatible con MAC / PC, completamente desbloqueado
No Se Necesita Experiencia; Fáciles De Seguir
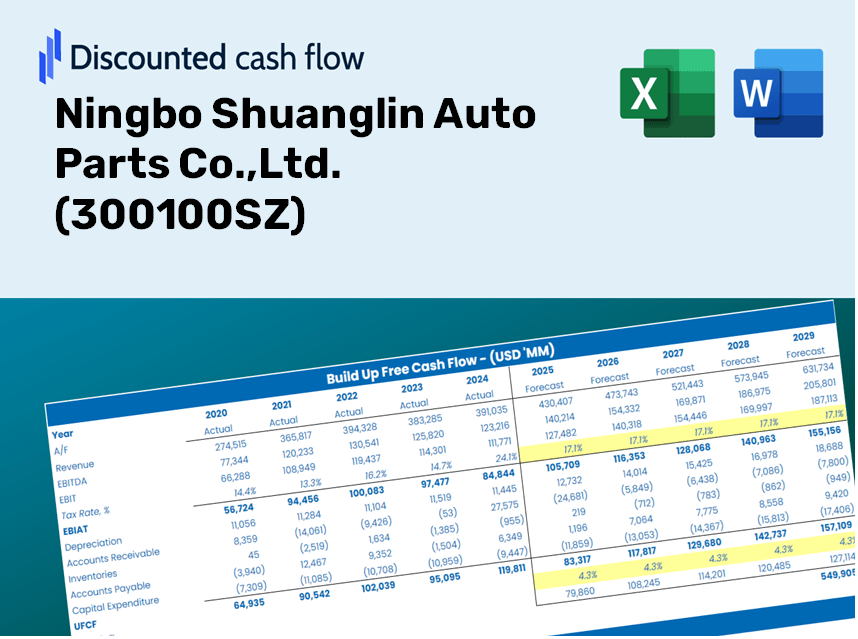
Ningbo Shuanglin Auto Parts Co.,Ltd. (300100.SZ) Bundle
¿Busca determinar el valor intrínseco de Ningbo Shuanglin Auto Parts Co., Ltd.? Nuestra calculadora DCF (300100SZ) integra datos del mundo real con extensas funciones de personalización, lo que le permite ajustar los pronósticos y mejorar sus estrategias de inversión.
Discounted Cash Flow (DCF) - (USD MM)
| Year | AY1 2020 |
AY2 2021 |
AY3 2022 |
AY4 2023 |
AY5 2024 |
FY1 2025 |
FY2 2026 |
FY3 2027 |
FY4 2028 |
FY5 2029 |
|---|---|---|---|---|---|---|---|---|---|---|
| Revenue | 3,576.7 | 3,682.3 | 4,185.3 | 4,100.9 | 4,910.5 | 5,332.0 | 5,789.7 | 6,286.7 | 6,826.4 | 7,412.4 |
| Revenue Growth, % | 0 | 2.95 | 13.66 | -2.02 | 19.74 | 8.58 | 8.58 | 8.58 | 8.58 | 8.58 |
| EBITDA | 534.7 | 570.0 | 485.5 | 514.3 | 862.1 | 769.2 | 835.2 | 906.9 | 984.7 | 1,069.3 |
| EBITDA, % | 14.95 | 15.48 | 11.6 | 12.54 | 17.56 | 14.43 | 14.43 | 14.43 | 14.43 | 14.43 |
| Depreciation | 357.7 | 340.9 | 356.3 | 361.1 | 321.7 | 459.9 | 499.4 | 542.3 | 588.8 | 639.4 |
| Depreciation, % | 10 | 9.26 | 8.51 | 8.81 | 6.55 | 8.63 | 8.63 | 8.63 | 8.63 | 8.63 |
| EBIT | 177.0 | 229.1 | 129.2 | 153.2 | 540.4 | 309.2 | 335.8 | 364.6 | 395.9 | 429.9 |
| EBIT, % | 4.95 | 6.22 | 3.09 | 3.74 | 11 | 5.8 | 5.8 | 5.8 | 5.8 | 5.8 |
| Total Cash | 412.8 | 834.9 | 467.2 | 477.8 | 632.8 | 745.6 | 809.6 | 879.1 | 954.5 | 1,036.5 |
| Total Cash, percent | .0 | .0 | .0 | .0 | .0 | .0 | .0 | .0 | .0 | .0 |
| Account Receivables | 1,457.5 | 1,514.9 | 1,803.5 | 2,090.0 | 2,277.9 | 2,371.0 | 2,574.5 | 2,795.5 | 3,035.5 | 3,296.0 |
| Account Receivables, % | 40.75 | 41.14 | 43.09 | 50.97 | 46.39 | 44.47 | 44.47 | 44.47 | 44.47 | 44.47 |
| Inventories | 842.1 | 940.2 | 957.3 | 1,023.7 | 1,017.1 | 1,254.4 | 1,362.1 | 1,479.0 | 1,606.0 | 1,743.8 |
| Inventories, % | 23.54 | 25.53 | 22.87 | 24.96 | 20.71 | 23.53 | 23.53 | 23.53 | 23.53 | 23.53 |
| Accounts Payable | 1,604.4 | 1,638.0 | 1,865.2 | 1,166.9 | 2,273.6 | 2,225.2 | 2,416.2 | 2,623.6 | 2,848.8 | 3,093.3 |
| Accounts Payable, % | 44.86 | 44.48 | 44.57 | 28.45 | 46.3 | 41.73 | 41.73 | 41.73 | 41.73 | 41.73 |
| Capital Expenditure | -206.6 | -253.1 | -213.1 | -277.4 | -296.2 | -325.6 | -353.6 | -383.9 | -416.9 | -452.7 |
| Capital Expenditure, % | -5.78 | -6.87 | -5.09 | -6.77 | -6.03 | -6.11 | -6.11 | -6.11 | -6.11 | -6.11 |
| Tax Rate, % | 2.29 | 2.29 | 2.29 | 2.29 | 2.29 | 2.29 | 2.29 | 2.29 | 2.29 | 2.29 |
| EBITAT | 140.4 | 198.4 | 104.3 | 116.5 | 528.0 | 260.0 | 282.3 | 306.5 | 332.8 | 361.4 |
| Depreciation | ||||||||||
| Changes in Account Receivables | ||||||||||
| Changes in Inventories | ||||||||||
| Changes in Accounts Payable | ||||||||||
| Capital Expenditure | ||||||||||
| UFCF | -403.7 | 164.2 | 169.1 | -851.2 | 1,479.1 | 15.5 | 307.9 | 334.3 | 363.0 | 394.2 |
| WACC, % | 6.17 | 6.18 | 6.17 | 6.16 | 6.2 | 6.18 | 6.18 | 6.18 | 6.18 | 6.18 |
| PV UFCF | ||||||||||
| SUM PV UFCF | 1,144.8 | |||||||||
| Long Term Growth Rate, % | 2.00 | |||||||||
| Free cash flow (T + 1) | 402 | |||||||||
| Terminal Value | 9,626 | |||||||||
| Present Terminal Value | 7,133 | |||||||||
| Enterprise Value | 8,278 | |||||||||
| Net Debt | 176 | |||||||||
| Equity Value | 8,102 | |||||||||
| Diluted Shares Outstanding, MM | 398 | |||||||||
| Equity Value Per Share | 20.38 |
What You Will Receive
- Authentic 300100SZ Financial Data: Pre-loaded with Ningbo Shuanglin Auto Parts Co., Ltd.'s historical and forecasted data for accurate analysis.
- Completely Customizable Template: Easily adjust key variables such as revenue growth, WACC, and EBITDA percentage.
- Instant Calculations: Watch the intrinsic value of 300100SZ update in real-time as you modify inputs.
- Professional Valuation Tool: Crafted for investors, analysts, and consultants aiming for precise DCF outcomes.
- User-Friendly Interface: Intuitive layout and straightforward instructions suitable for all skill levels.
Key Features
- Comprehensive Historical Data: Detailed financial statements and historical forecasts for Ningbo Shuanglin Auto Parts Co., Ltd. (300100SZ).
- Customizable Parameters: Modify key inputs such as WACC, tax rates, revenue growth, and EBITDA margins.
- Real-Time Calculations: Observe the intrinsic value of Ningbo Shuanglin Auto Parts Co., Ltd. (300100SZ) update instantly.
- Intuitive Visual Insights: Engaging dashboard charts present valuation outcomes and essential metrics.
- Designed for Precision: A robust tool tailored for analysts, investors, and financial professionals.
How It Works
- Step 1: Download the Excel spreadsheet provided.
- Step 2: Examine the pre-filled financial data and projections for Ningbo Shuanglin Auto Parts Co., Ltd. (300100SZ).
- Step 3: Adjust key inputs such as revenue growth, WACC, and tax rates (highlighted cells).
- Step 4: Observe the DCF model refresh in real-time as you modify your assumptions.
- Step 5: Review the outcomes and leverage the findings for informed investment decisions.
Why Opt for Ningbo Shuanglin Auto Parts Co., Ltd.?
- Time Efficient: Skip the hassle of starting from scratch – our solutions are readily available.
- Enhanced Precision: Dependable data and methodologies minimize valuation errors.
- Customizable Solutions: Adjust our offerings to match your specific assumptions and forecasts.
- User-Friendly: Intuitive charts and outputs simplify result interpretation.
- Expert Recommended: Crafted for professionals who prioritize both accuracy and ease of use.
Who Should Utilize This Product?
- Professional Investors: Create comprehensive and trustworthy valuation models for assessing portfolios related to Ningbo Shuanglin Auto Parts Co., Ltd. (300100SZ).
- Corporate Finance Teams: Examine valuation scenarios to inform strategic decisions within their organizations.
- Consultants and Advisors: Equip clients with precise valuation insights pertaining to Ningbo Shuanglin Auto Parts Co., Ltd. (300100SZ).
- Students and Educators: Access real-time data to enhance learning experiences in financial modeling.
- Auto Industry Enthusiasts: Gain a deeper understanding of how automotive companies like Ningbo Shuanglin Auto Parts Co., Ltd. (300100SZ) are evaluated in the marketplace.
Contents of the Template
- Pre-Filled Data: Contains Ningbo Shuanglin Auto Parts Co., Ltd.'s historical financial data and forecasts.
- Discounted Cash Flow Model: A customizable DCF valuation model with automatic calculation features.
- Weighted Average Cost of Capital (WACC): A dedicated worksheet for calculating WACC based on user-defined inputs.
- Key Financial Ratios: Evaluate Ningbo Shuanglin's profitability, operational efficiency, and financial leverage.
- Customizable Inputs: Easily modify revenue growth rates, profit margins, and tax rates.
- Clear Dashboard: Visual displays including charts and tables to summarize key valuation outcomes.
Disclaimer
All information, articles, and product details provided on this website are for general informational and educational purposes only. We do not claim any ownership over, nor do we intend to infringe upon, any trademarks, copyrights, logos, brand names, or other intellectual property mentioned or depicted on this site. Such intellectual property remains the property of its respective owners, and any references here are made solely for identification or informational purposes, without implying any affiliation, endorsement, or partnership.
We make no representations or warranties, express or implied, regarding the accuracy, completeness, or suitability of any content or products presented. Nothing on this website should be construed as legal, tax, investment, financial, medical, or other professional advice. In addition, no part of this site—including articles or product references—constitutes a solicitation, recommendation, endorsement, advertisement, or offer to buy or sell any securities, franchises, or other financial instruments, particularly in jurisdictions where such activity would be unlawful.
All content is of a general nature and may not address the specific circumstances of any individual or entity. It is not a substitute for professional advice or services. Any actions you take based on the information provided here are strictly at your own risk. You accept full responsibility for any decisions or outcomes arising from your use of this website and agree to release us from any liability in connection with your use of, or reliance upon, the content or products found herein.